|
page 52 |
Stewart's
SEA-Horse Corral Lambert Creek Curlew Rim Ranches |

|
|
page 52 |
Stewart's
SEA-Horse Corral Lambert Creek Curlew Rim Ranches |
|
Since Google abandoned the GMap service,  I have now converted the property lines and survey monuments into the format for Google Earth. I have now converted the property lines and survey monuments into the format for Google Earth.Download this file: ![[KMZ]](images/iconArt/kmz-60.png) CRR Divisions 1 2 and 3 or CRR Divisions 1 2 and 3 or ![[KML]](images/iconArt/kml-60.png) This is the Supplement and Legend for the 173 survey monuments and official markers that I have personally geo-located. |
| Legend for symbols on map | |
|
Black lines are calculated from the official survey documents, AFN (Auditors File Number) 154986 and 159926 for Division 1, AFN 157150 for Division 2, AFN 159130 for Division 3 I created a huge spreadsheet to calculate distances and bearings based on the section corners and recorded surveys (which have the measurements). The section corners are the anchors. All lines inside the section are floating independant from any physical locating of said corners (except for key corners of the development that do not measure out farther to the nearest section outside the development), thus intending to make it clear where the differences exist between calculated corners based on the 1969 survey (black lines), and actual placement of survey markers (as found today, although considering I am using consumer grade equipment, I took extra care to mitigate that issue by measuring multiple times with averaged waypoints. Results from a professional surveyor will probably differ, but that last meter of accuracy will cost a thousand.) I visited nearly all of the key corners to help determine where to place this grid. The only incomplete gaps are to the west of section 27. Comparing the black lines to the public GIS databases that went into making all the Topo maps, Section line overlays, and similar public land boundary maps, reveals a consistant deviation from reality to ancient maps. And not always in the same direction. Some property line corners are also skewed or offset, sometimes in a consistant line (Sec 26 center top) that indicates one mismeasurement shifted the entire line (to the south) to be placed with a consistant deviation. The south line of lot 35 in division 1 is also one we found to be short by 7 ft from the brass coin to our rebar corner, measured with fiberglass tape. So I had a good reason to start this project in 2004. Also when a Spokane surveyor hired me to find a corner he couldn't find, I started to realize why the courthouse and auditors office said CRR was messed up. This kind of detail shows up when fully Zoomed in, showing all markers I have found. Red solid lines highlight the ACTUAL location for Section boundaries, where the CRR grid overlaps with the black lines. White and brass markers are the correct corners to match physically on the ground. From these markers, a grid of red lines could be drawn across the remaining sections if one wishes it. But that would no longer intersect the CRR black lines. The west line of Section 27 clearly shows a 100 ft difference between the public maps and the actual (fencelines) on the ground. The section line does not go right through that house. Thereby proving the old maps do not take precident over physical surveying. In checking the accuracy of online databases for converting PLSS (Public Land Survey System) to GPS coordinates, I found earthpoint.us to have the highest accuracy. Yellow dashed lines are added straight from this database, and these line up with the various topos and overlays, mostly. There are some glaring inconsistancies: in T37N R34E, the line between sections 6 and 5 differs. Section 4, NW corner. There are two official Cadastral survey caps about 220 ft apart, proving the section lines here are not supposed to meet at One point, as many maps indicate. For this section, I've added an Aqua line to show the correct section line location. A couple Orange dashed lines are from geocommunicator.gov and differ from the earthpoint.us lines because they include a point at the 1/2 section line. I only did the one section at this time, since this direction of study looked to add nothing useful to my map. Several useful overlays are available with Gmap.
| |
Also note that there are several aerial maps, topo maps, and Open Street Map layers available, representing different points in time (and accuracy).
| |
|
Unfortunately Google has stopped offering un-paid service for GMap, which provided this level of aerial mapping, in browser. The broken link was Gmap of property lines Another service to mapping Washington State Lands [Here] | |
| Notes | |
 enlarge to 2048x1427
On the Div.3 survey, there are 33 lots that do not exist, as the land was already surveyed and recorded as Division 1 lots. Plus 3 lots, highlighted in orange, that partially overlap Division 1 lots are not officially recorded as the size shown on this AFN. The Division 3 AFN has other errors also, like drawing an easement across private property the original developers were unable to purchase. Now the too-steep road has been there too long to undo. And too few routes to egress in case of fire. Like Judge Monasmith said in 2013, many requirements for modern developments, were not met here, and if they had been met, the kind of conflicts he had to preside over would never have happened. Sadly the judge's orders continue to be ignored, as some people gate and block the easement roads illegally, others just yelling at people to not drive across their yard, which is still a form of blocking. Zooming in to several corners reveals many abnormalities, and this is the reason for all the work I have done mapping my neighborhood. The observant reader will question why I geo-located only some of the many corners, and the answer is that I simply avoided occupied properties where I might not be welcome. There is plenty to access freely by open range and adjacent public lands. There are also many corners where I could not physically locate the rebar marker. I am not including those on this map. My preferred way to walk the property lines, is by loading my Garmin with the property lines. You can do the same with these GPX files:
|
 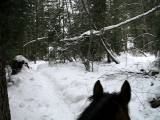 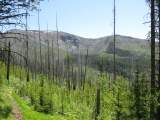 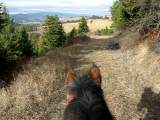 Many photos of Okanogan Highlands 2002-2013  Easements described on AFN 154986 [JPG] that include 60 ft. right of ways, and riding trails. A point of dispute with some unfriendly people who did not first read the covenants before signing to the title. Easements described on AFN 154986 [JPG] that include 60 ft. right of ways, and riding trails. A point of dispute with some unfriendly people who did not first read the covenants before signing to the title.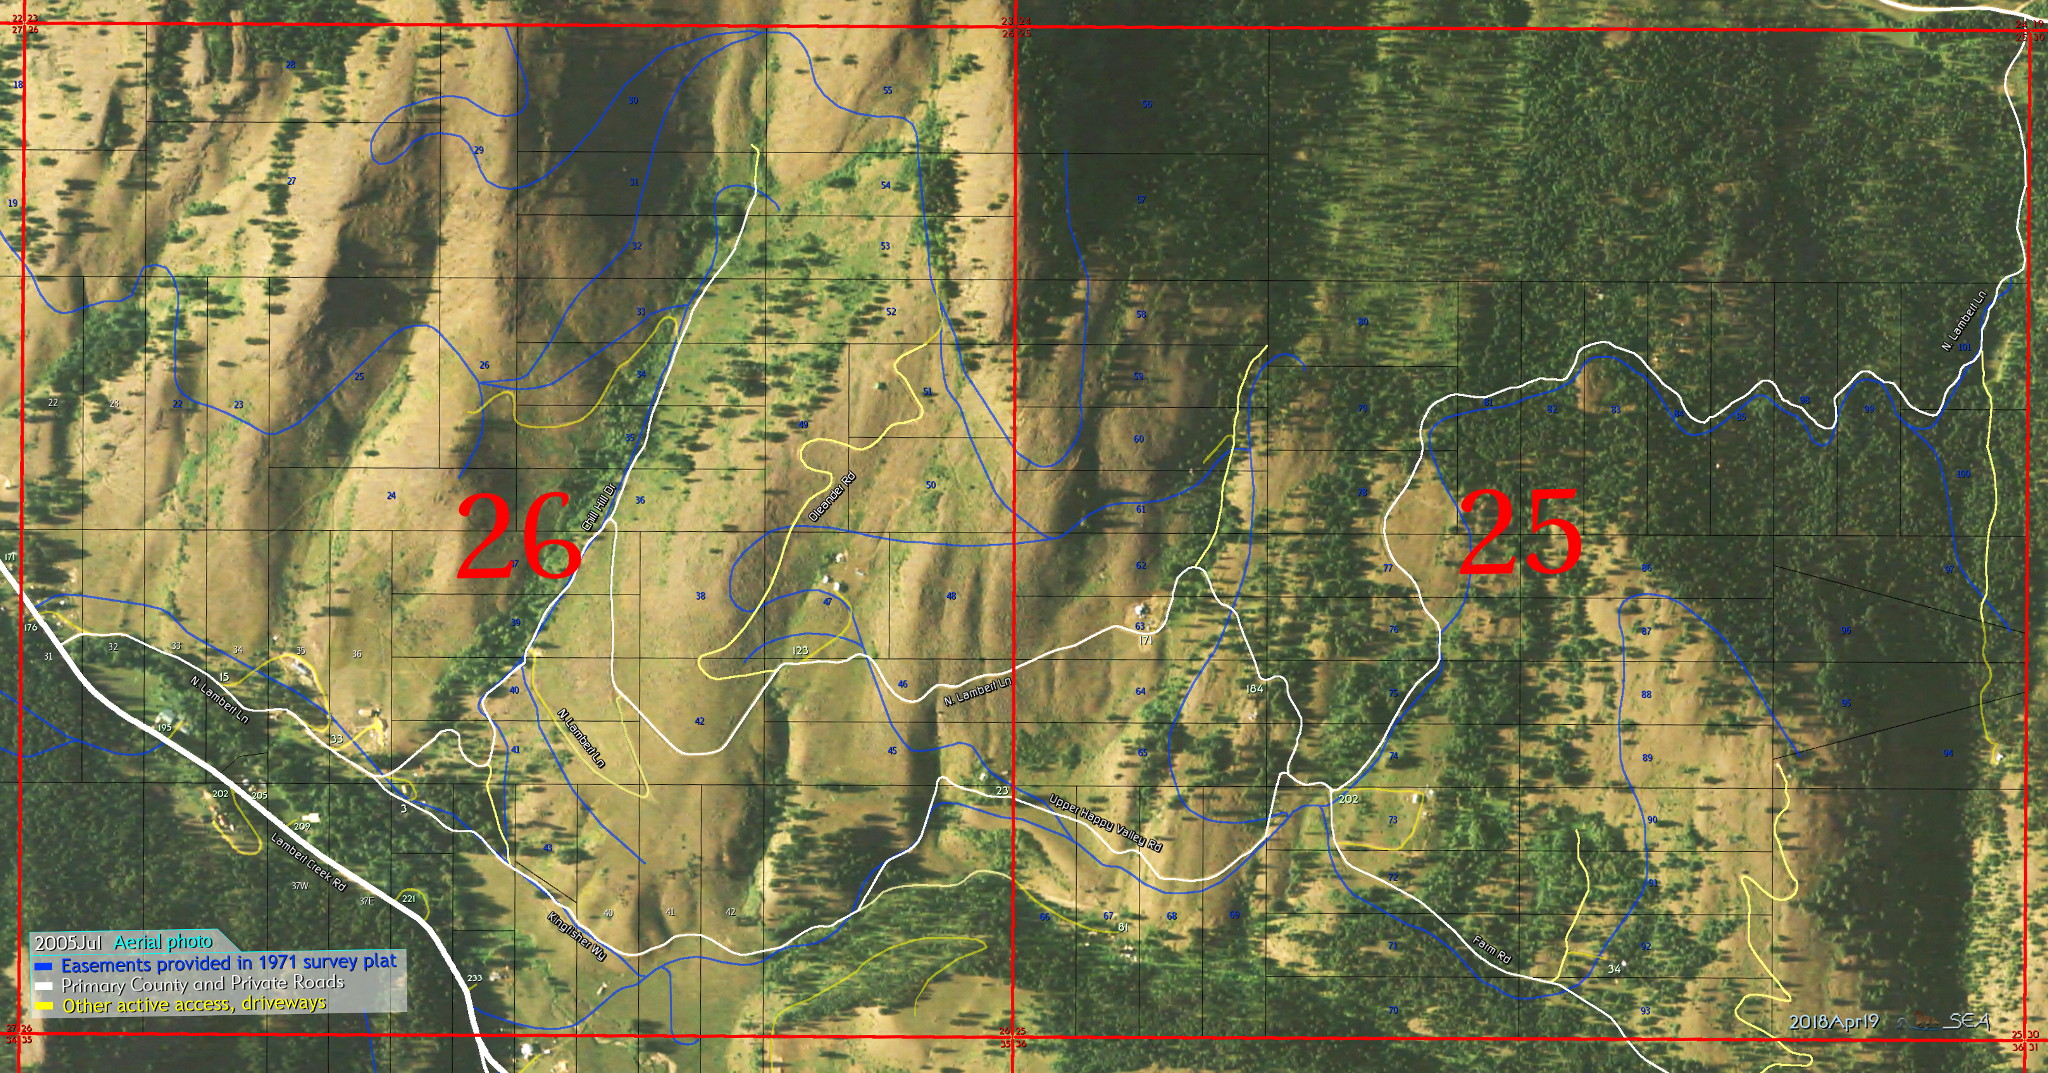 enlarge to 2048x1073
This map I last updated in 2011 with 2005 aerial photos, shows the easements in blue. Few of these lines match up with actual roadways (white for primary and yellow for secondary), so while some roads may be newer than the survey date, since even the ones that were here in 1969 are off by hundreds of feet, I question how drunk the surveyors were back then. No! Seriously! In a careful analysis of their suggested location for easements and future roadways, I can show 4 locations that go (nearly) vertical up or down the side of the mountain. Digitizing these blue lines to add to the Gmap4 project, would be a lot of work...but in practical terms, the blue lines don't really matter, as they only suggest where roads might be placed. Actual and existing roads take precedence, and since the blue lines were never surveyed, they have little value today, except to show their intent to provide access to everybody. It's easier to conclude they were just rushed and unprofessional. Years later it becomes more apparent they just stopped, and did not finish. Probably because they could not purchase all the properties they wanted to provide access through and across. Even today there is no money to go out and professionally survey any of these rural lands, to bring any of the old maps into the 21st century, and get them digitally accurate. A more important reason to survey actual roadways, is to legalize the easements. Right now most of these properties away from the county road, have No Legal Easement. This is a problem, that nobody official wants to address or fix. As long as the existing roadway crosses the CRR development, it is a somewhat mutual and balanced problem. But where the roads cross private property not encumbered by the CRR development's easements.... That is a serious question whose rights come first. My riding log (separate from my geo-locating activities) shows how far I rode here: [monthly animation: 10 years in 39 seconds with elevation and snow cover MPEG4 1024x768 5.9Mb AVI] or 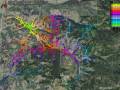 [animation without elevation and snow cover: MPEG4 1024x768 5.0Mb AVI] [animation without elevation and snow cover: MPEG4 1024x768 5.0Mb AVI]This is the map (mentioned in the court hearing after the 2013 dog attack) that my 82 pages of detailed logs and barn records made possible because I did record our hours, and miles, and paths taken, by each horse, making it possible to reconstruct my travels over the years here. 97 percent of my riding was on roadways and easements. I never rode cross-country on private property, as a point of honor that I refused to travel illegally. Unfortunately, that put me in the crosshairs of the local druggies on the roads. That's another story, but in short... I lost.
Another point of interest for those concerned about access and the state of the roads, some places bad enough to be called goat trails. Not only are the hills steep, but so are the private access roads. North Lambert Lane from the bottom to the Chill Hill Drive (formerly Whackmaster) intersection, gets as high as 12 degrees or 21% slope. From Kingfisher Rd up Upper Happy Valley Rd peaks twice at 13 degrees or 24% slope. I have seen many attempts, over the years, to grade these after heavy rain events that create washouts. See the damage in 2004, 2009, 2011 at photo album, aka page 7 |
![[Home]](images/home.gif) |
|
![[Horse stories]](images/ebook-19990309-10.06-t60.jpg) |
![[e-Mail me]](images/mbicon.gif) |
![[GPX]](images/iconArt/gpx-60.png) Section monuments only, for all of Lambert drainage
Section monuments only, for all of Lambert drainage