|
|
Stewart's Corral Wildfire and relevant weather monitoring and links |
Page 63
visitor # |
|
|
Stewart's Corral Wildfire and relevant weather monitoring and links |
Page 63
visitor # |
Recommended links:Washington Smoke Information - Daily news and updates. Forecast and source of smoke is right here.Best map: Fire Situation Awareness Map - new map for 2020 InciWeb - Washington Earth : a global map of wind, weather, ocean conditions, and atmospheric modeling of particle density by satellite. This link goes directly to PM2.5 for the PNW. COD:GOES16 satellite true-color shows smoke, animated last 8 hours 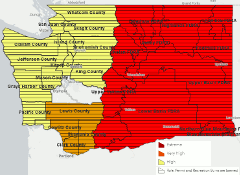 Washington Fire Danger by wildland zone
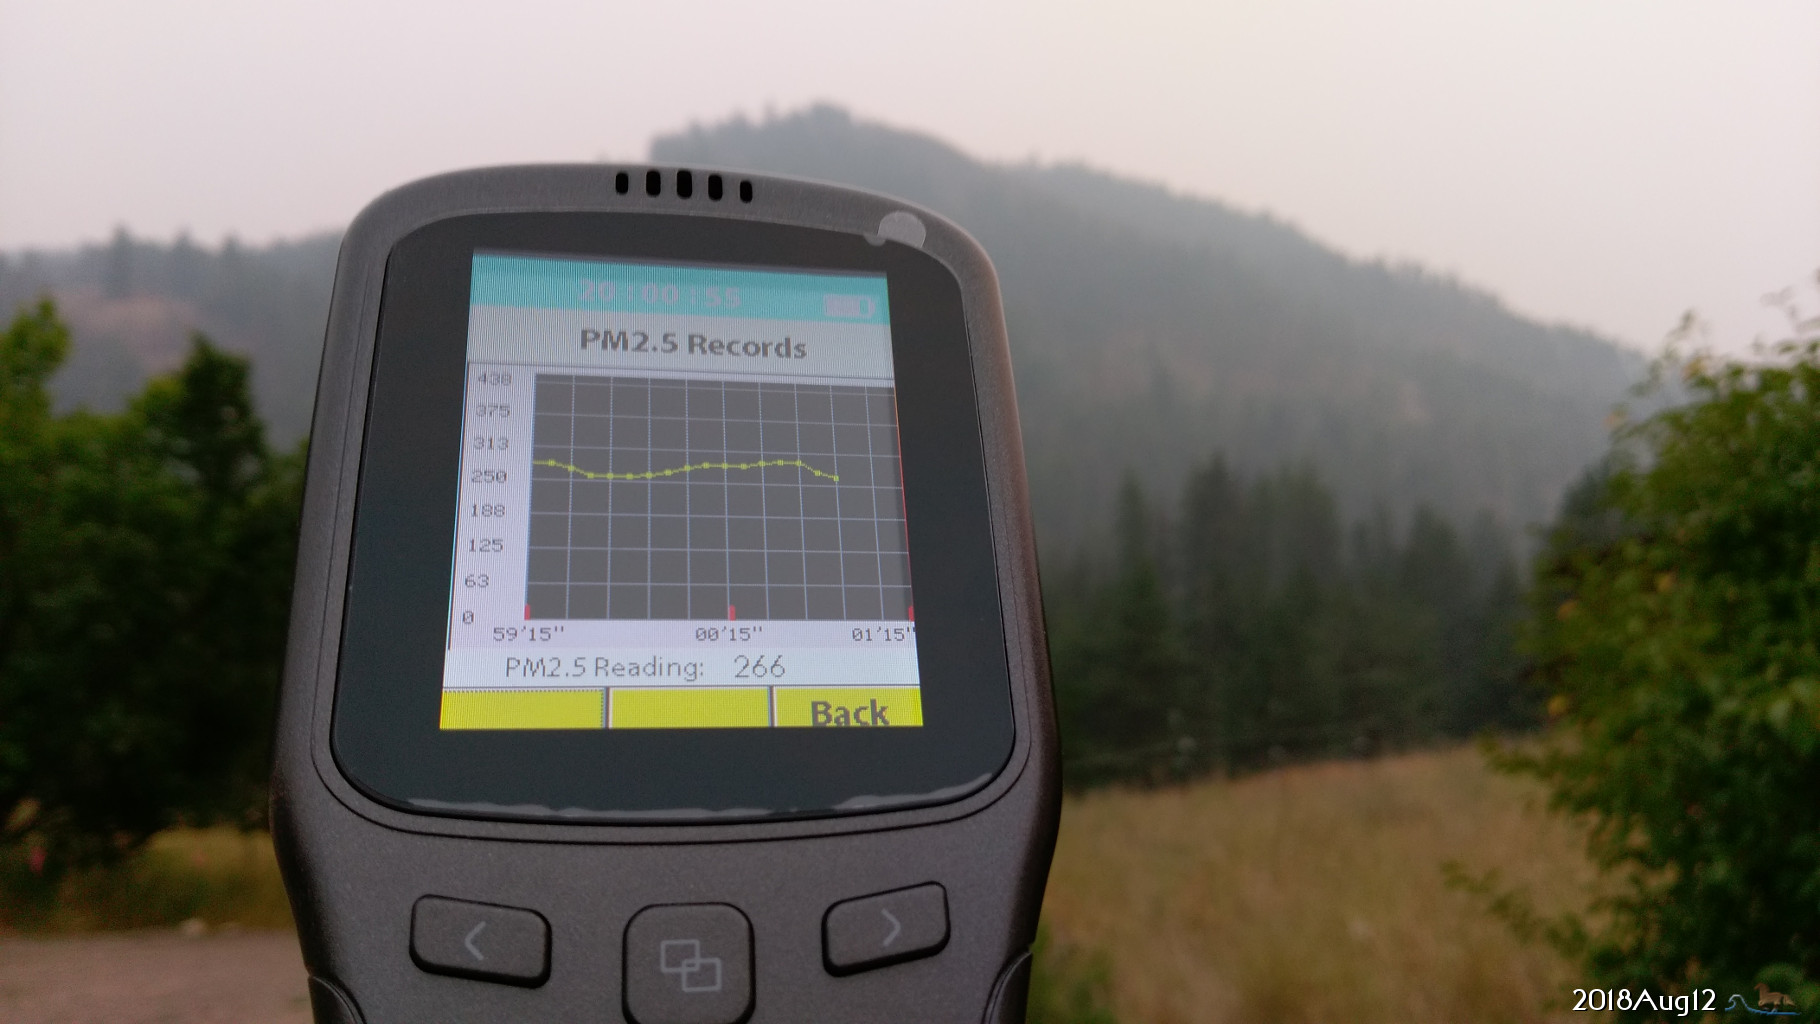
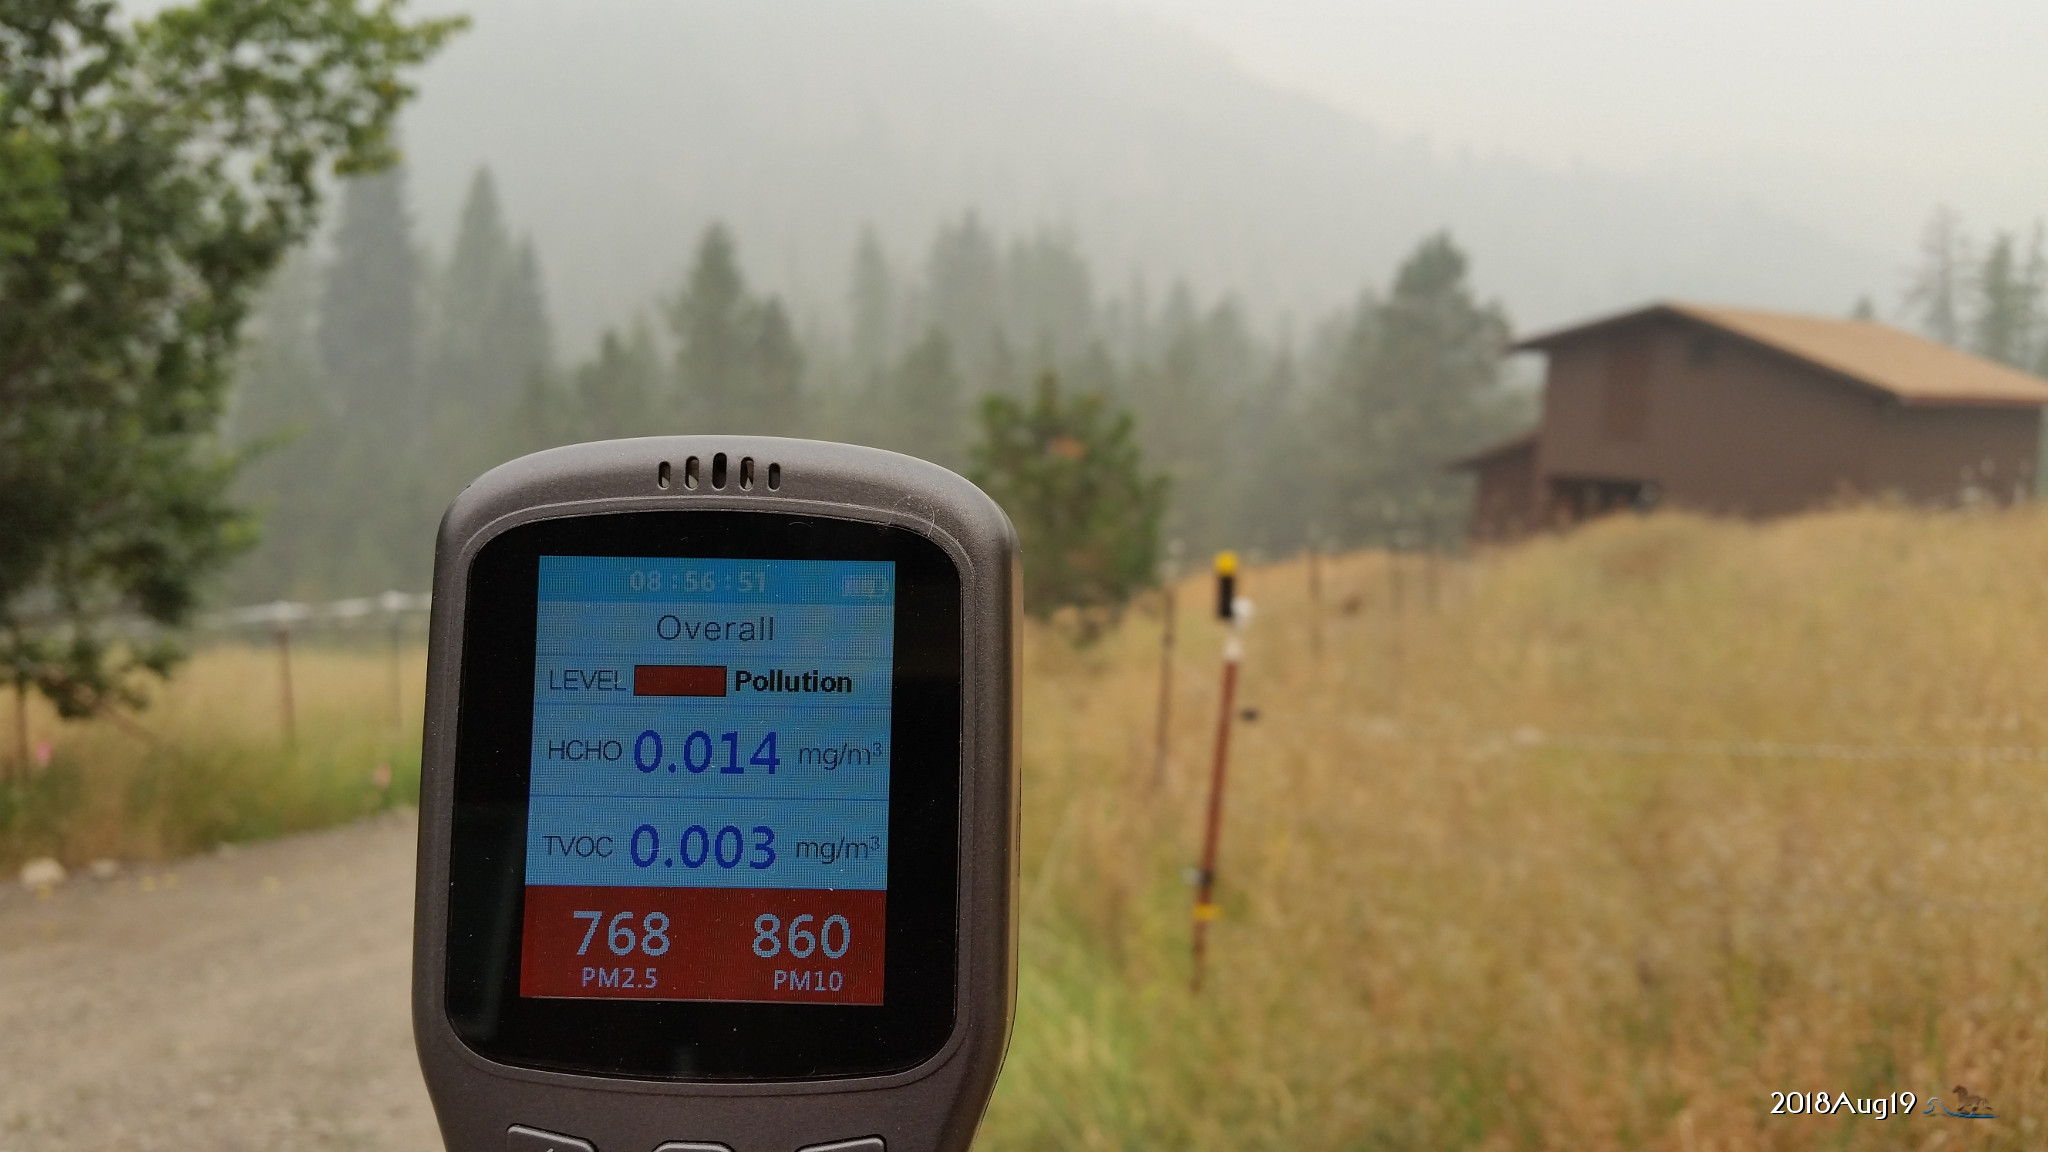
Even Puget Sound was under Extreme Fire danger in 2021. Very unusual and bad. NorthWest Interagency Coordination Center - Latest updates Northeast Washington Travel Alerts 2024 is very hot, persistant widespread heat, areas of drought, and dry lightning has started wildfire season early. Chart shows measured PM2.5 smoke and particles:  2023 has started early. The Canadian wildfire smoke has so far been limited in raising the AQI into the yellow zone. Lots of single event smoke and dust spikes are shown, but the majority of the black arrows are staying low. Chart shows measured PM2.5 smoke and particles: 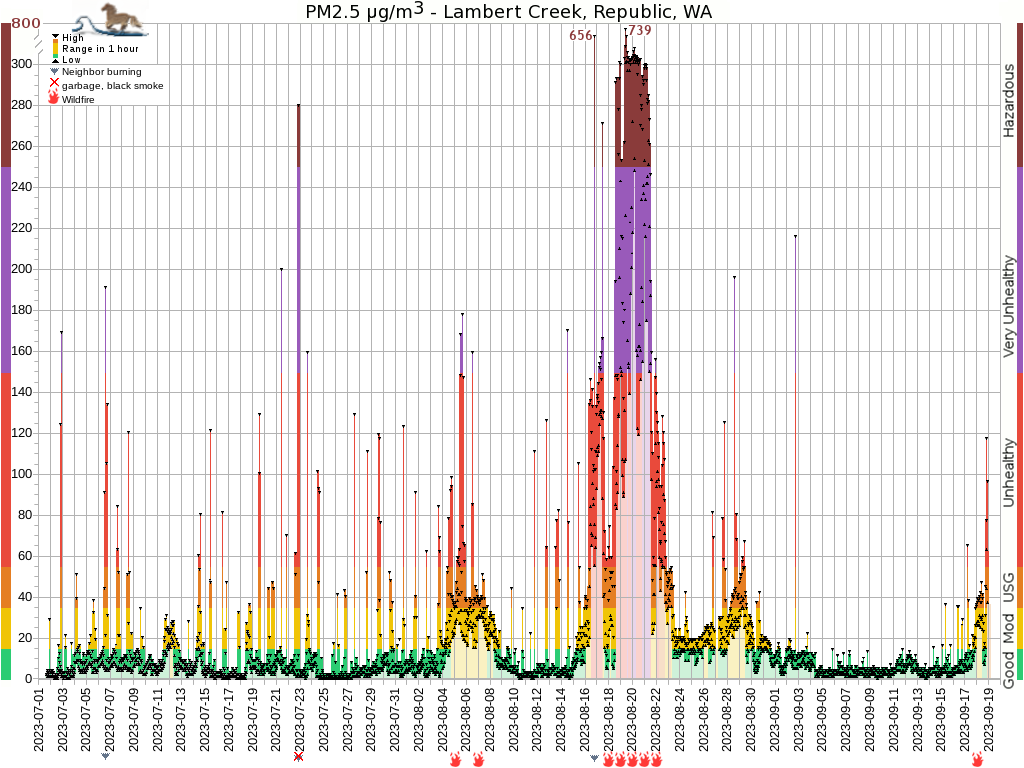 2022 Chart shows measured PM2.5 smoke and particles: 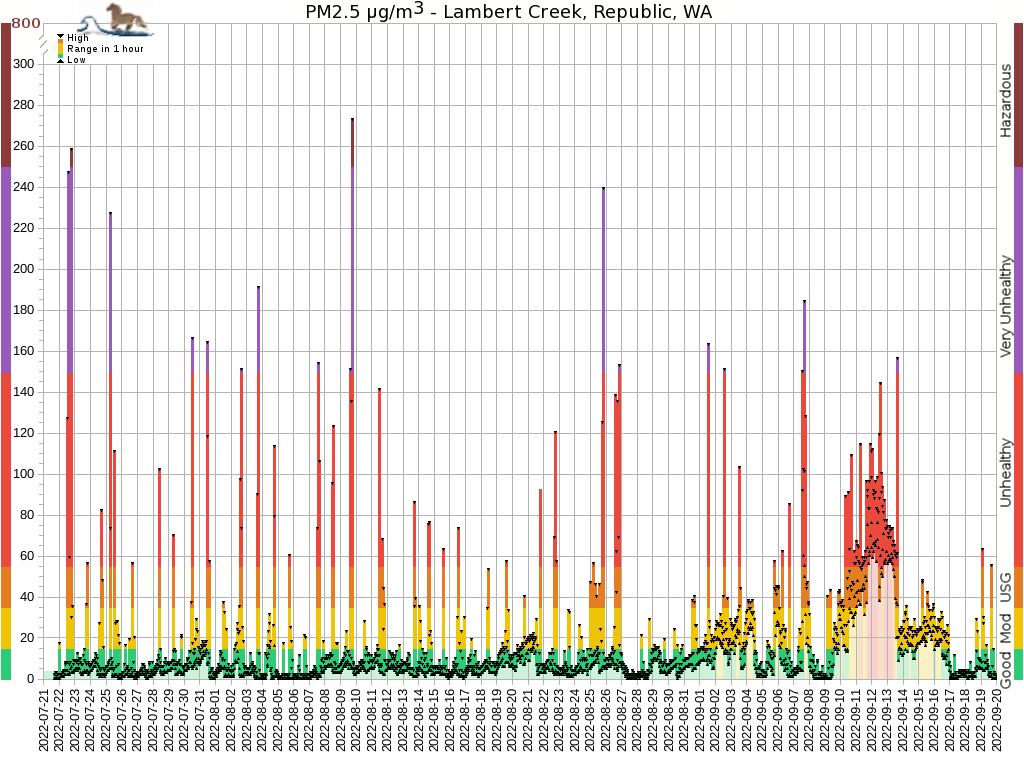 2021 has been mostly dry and hot. Any rain events are few and longer in between than normal. Some trees in late June are parched and looking like autumn. Record breaking heat wave region wide smashes many long time temperature records. Even though it's a few weeks early, I unfortunately need to start the Temtop, for logging PM2.5 measurements every minute. Chart shows measured PM2.5 smoke and particles: 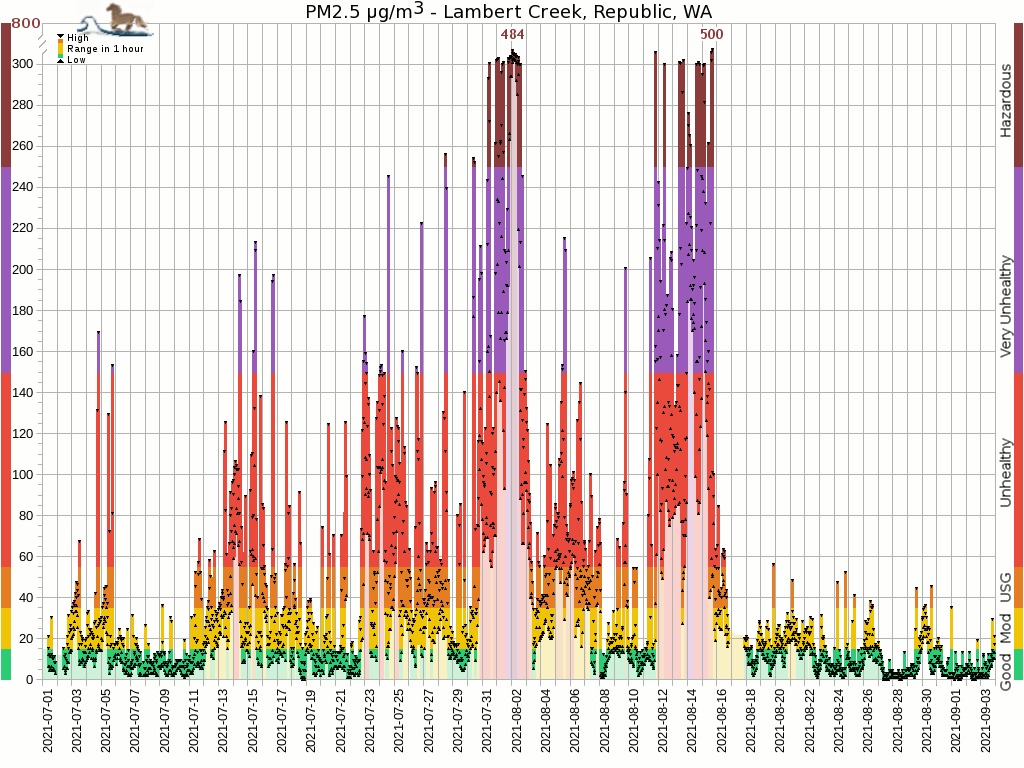 Sep.07 was day number 22 in the purple (Very Unhealthy) or worse (Hazardous), so 2021 was very far ahead of normal, 25 days ahead of of 2018. 2020 started wet and cold, but now fire season has finally arrived with many days without measurable rainfall. Chart shows measured PM2.5 smoke and particles: 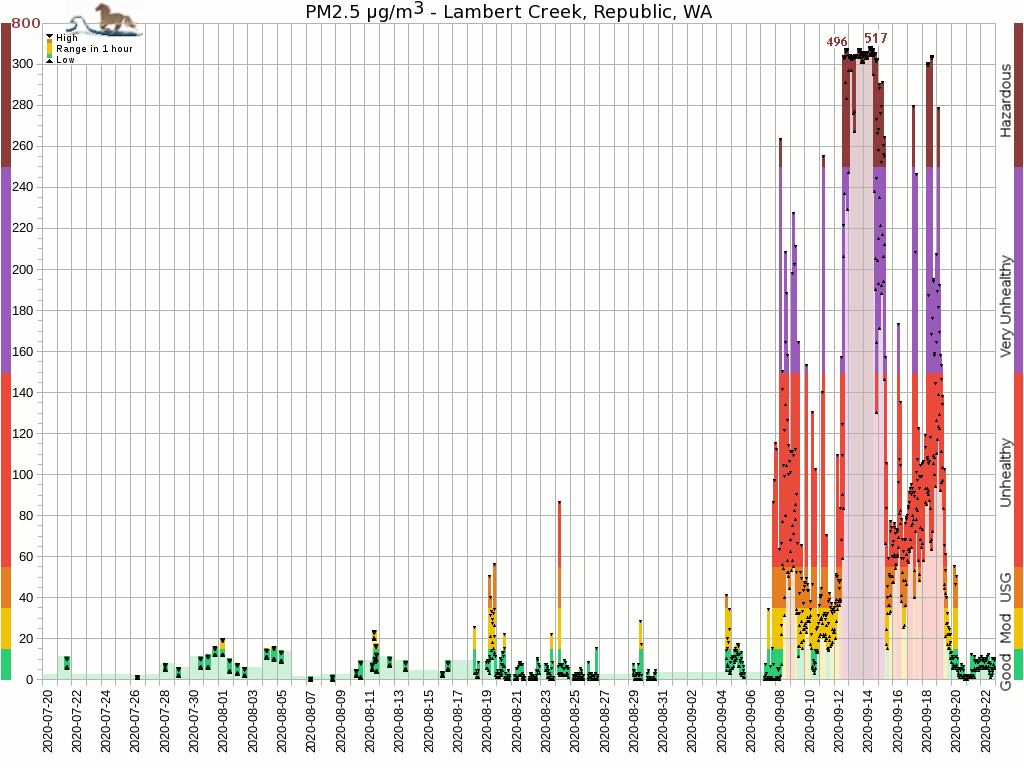 Sep.19 was day number 12 in the purple (Very Unhealthy) or worse (Hazardous), so 2020 was tied with 2018. Also, this might be the first time I've seen overnight minimums with no recovery below the hazardous line at 250µg/m³. Starting 2020.Aug.19 I'm recording in 1 minute intervals with a new Temtop meter. The above chart is created by summarizing the 1 minute data into 1 hour blocks, maximum over minimum, in the same style as previous years (except higher resolution) to highlight the range of actual readings, and actual minimums. While this chart is not live, (see time stamp at bottom of page) I do keep it up to date, especially when changing conditions merrit. 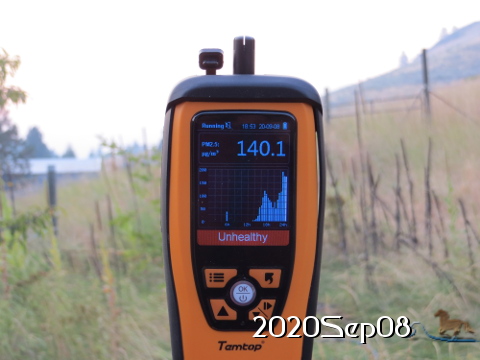 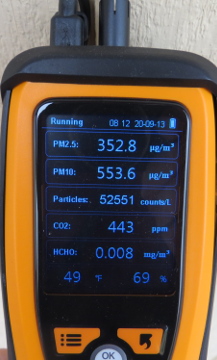 Without compression, here is a 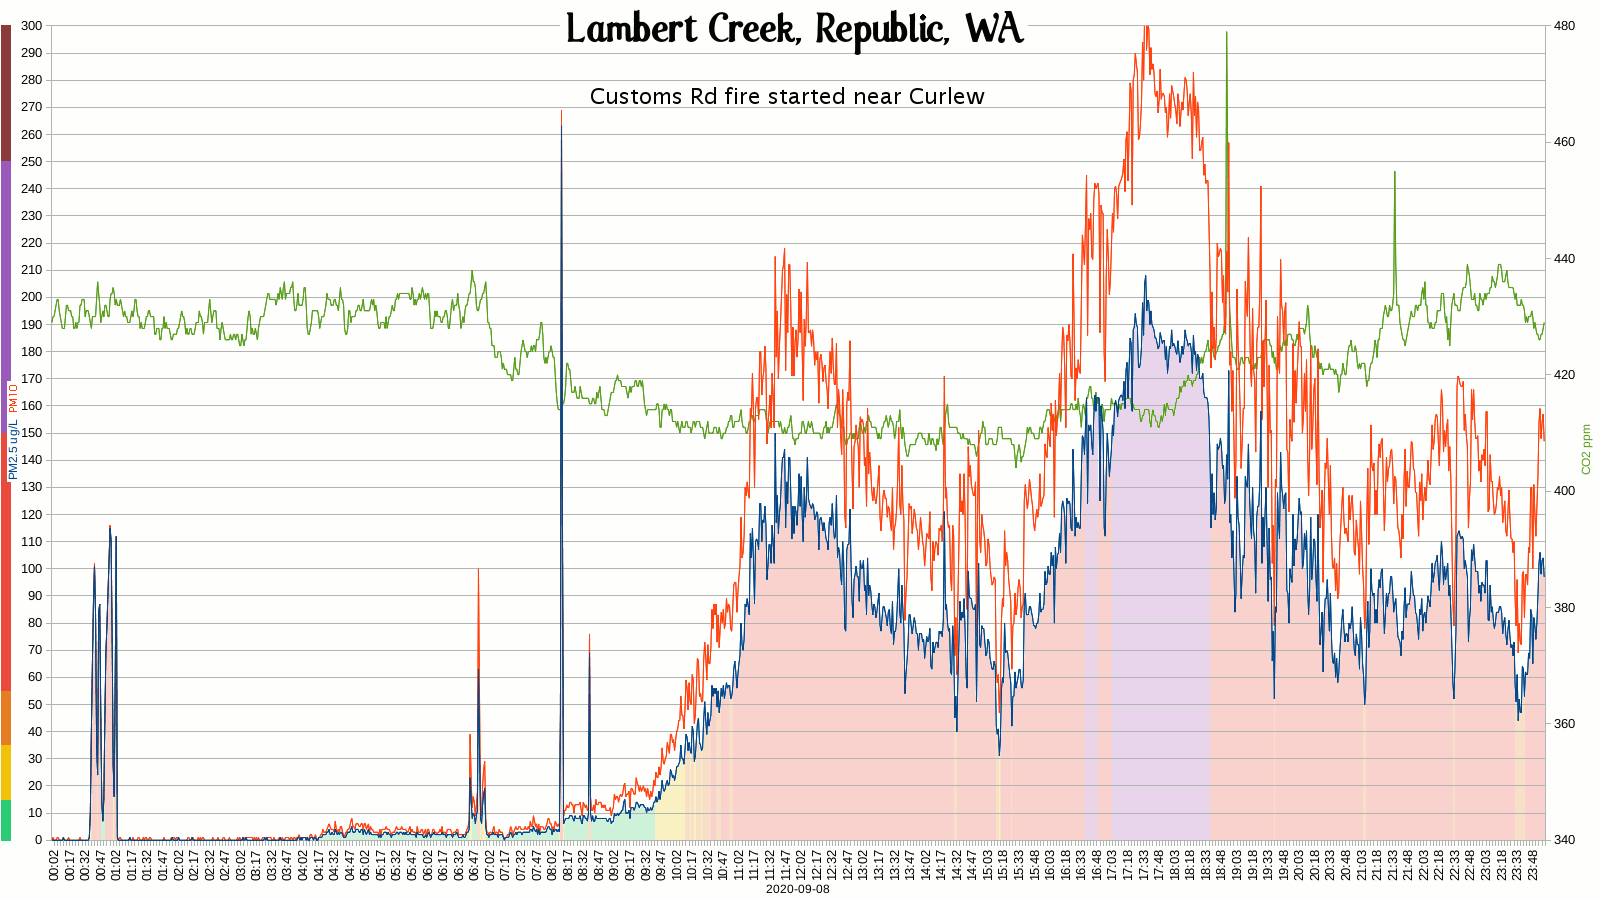 Single day, includes PM10 and CO2 for 2020.Sep.08, the day the Customs Road fire started in Curlew. Single day, includes PM10 and CO2 for 2020.Sep.08, the day the Customs Road fire started in Curlew.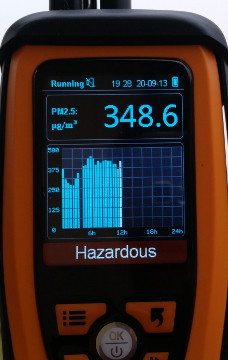 2020.Sep.13-14 Yes, it is very bad. 2018 has been extremely hot and dry above and beyond our normal average. Chart shows measured PM2.5 smoke and particles: 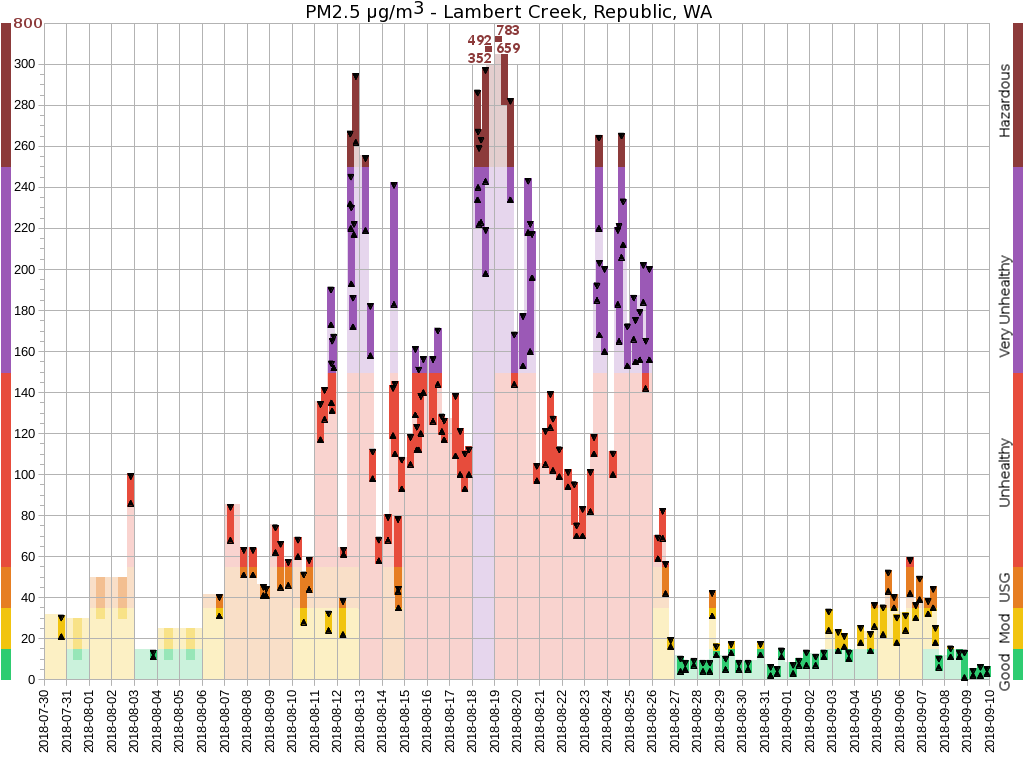 Number of days in the purple or worse, 12, makes 2018 tied with 2015, but was perceived to be the worst year overall. With 6 days in the brown (Hazardous), the numbers agree. Compare to previous years graphs: 2017 Measured PM2.5 smoke and particles: 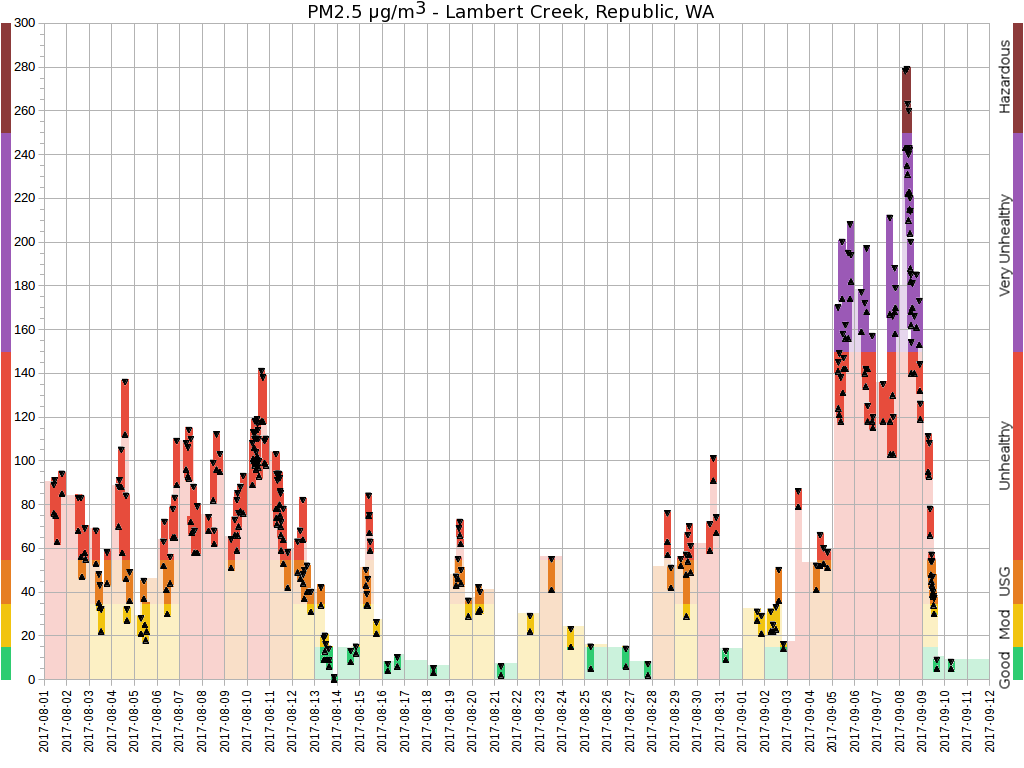 Number of days in the purple or worse = 4. 2016 Had no emergency in this area, in fact only 4 days of noticable smoke. 2015 Was before I acquired this meter, but it was because of the events of 2015 that I did. Before 2015 there were occasional fires, but not a crazy, oppressive, and reoccuring problem like it has now become. Fires started by lightning, started 2015.Aug.12. Level 2 evacuations of Republic started Aug.23 and lasted a week, with the hospital residents returning Sep.06. A temporary Air quality meter was installed in Republic on Aug.25 during this emergency. The brief results were: 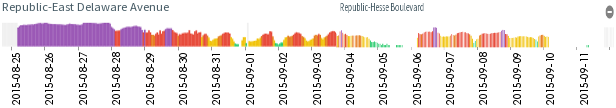 Estimated number of days in the purple or worse = 10-12. Back to 2018 for pictures:
|
|
Climate data for Lambert Creek, Republic, WA Elevation 2815 ft. (858 m) | |||||||||||||
| Month | Jan | Feb | Mar | Apr | May | Jun | Jul | Aug | Sep | Oct | Nov | Dec | Year |
|---|---|---|---|---|---|---|---|---|---|---|---|---|---|
| Record high °F (°C) | 52.7 (11.5) |
59.6 (15.3) |
73.3 (22.9) |
90.2 (32.3) |
100.1 (37.8) |
111.6 (44.2) |
110.0 (43.3) |
107.6 (42.0) |
101.7 (38.7) |
88.0 (31.1) |
61.6 (16.4) |
52.0 (11.1) |
111.6 (44.2) |
| Record low °F (°C) | -22.7 (-30.4) |
-19.9 (-28.8) |
-9.2 (-22.9) |
11.0 (-11.7) |
17.5 (-8.1) |
26.8 (-2.9) |
32.0 ( 0.0) |
31.3 (-0.4) |
23.2 (-4.9) |
4.5 (-15.3) |
-17.9 (-27.7) |
-21.3 (-29.6) |
-22.7 (-30.4) |
| Average high °F (°C) | 33.0 ( 0.6) |
40.8 ( 4.9) |
50.6 (10.3) |
61.6 (16.4) |
72.4 (22.4) |
79.7 (26.5) |
91.9 (33.3) |
89.1 (31.7) |
77.5 (25.3) |
58.8 (14.9) |
39.3 ( 4.1) |
31.6 (-0.2) |
60.5 (15.8) |
| Average low °F (°C) | 16.4 (-8.7) |
18.1 (-7.7) |
24.7 (-4.1) |
29.2 (-1.6) |
36.1 ( 2.3) |
42.7 ( 5.9) |
47.1 ( 8.4) |
45.6 ( 7.6) |
38.8 ( 3.8) |
30.7 (-0.7) |
23.2 (-4.9) |
16.7 (-8.5) |
30.8 (-0.7) |
| Average precipitation inches (mm) |
1.59 (40) |
1.06 (27) |
1.61 (41) |
1.63 (41) |
2.35 (60) |
2.60 (66) |
1.06 (27) |
1.06 (27) |
1.10 (28) |
1.44 (36) |
1.94 (49) |
2.20 (56) |
19.63 (498) |
| Average snowfall inches (cm) |
13.4 (34) |
7.9 (20) |
5.8 (15) |
2.4 (6) |
0.3 (1) |
0 (0) |
0 (0) |
0 (0) |
0 (0) |
0.7 (2) |
9.1 (23) |
16.3 (41) |
55.8 (142) |
| Average high °F (°C) | 34.2 ( 1.2) |
47.0 ( 8.3) |
57.9 (14.4) |
65.7 (18.7) |
80.2 (26.8) |
91.3 (32.9) |
94.8 (34.9) |
88.8 (31.5) |
75.4 (24.1) |
65.7 (18.7) |
41.0 ( 5.0) |
34.2 ( 1.2) |
64.7 (18.2) |
| Average low °F (°C) | 21.3 (-5.9) |
25.7 (-3.5) |
28.9 (-1.7) |
28.8 (-1.8) |
38.4 ( 3.6) |
46.6 ( 8.1) |
49.2 ( 9.6) |
47.1 ( 8.4) |
37.2 ( 2.9) |
34.2 ( 1.2) |
21.0 (-6.1) |
20.7 (-6.3) |
33.3 ( 0.7) |
| Precipitation inches (mm) |
1.54 (39) |
1.73 (44) |
2.57 (65) |
0.95 (24) |
1.52 (39) |
1.96 (50) |
0.27 ( 7) |
0.51 ( 13) |
0.43 (11) |
1.14 (29) |
1.47 (37) |
4.38 (111) |
18.47 (469) |
| Snowfall inches (cm) |
15.0 (38) |
7.9 (20) |
3.1 (8) |
0.6 (1) |
0 (0) |
0 (0) |
0 (0) |
0 (0) |
0 (0) |
0 (0) |
6.9 (17) |
23.3 (59) |
56.8 (144) |
| Average high °F (°C) | 33.1 ( 0.6) |
41.3 ( 5.2) |
51.1 (10.6) |
61.9 (16.6) |
72.9 (22.7) |
80.5 (26.9) |
92.1 (33.4) |
89.1 (31.7) |
77.3 (25.2) |
59.2 (15.1) |
39.5 ( 4.1) |
31.8 (-0.1) |
60.8 (16.0) |
| Average low °F (°C) | 16.8 (-8.5) |
18.7 (-7.4) |
25.0 (-3.9) |
29.2 (-1.6) |
36.3 ( 2.4) |
43.0 ( 6.1) |
47.2 ( 8.5) |
45.7 ( 7.6) |
38.7 ( 3.7) |
30.9 (-0.6) |
23.1 (-5.0) |
17.0 (-8.3) |
31.0 (-0.6) |
| Average precipitation inches (mm) |
1.58 (40) |
1.11 (28) |
1.68 (43) |
1.58 (40) |
2.29 (58) |
2.55 (65) |
1.00 (25) |
1.02 (26) |
1.06 (27) |
1.42 (36) |
1.90 (48) |
2.35 (60) |
19.55 (496) |
| Average snowfall inches (cm) |
13.5 (34) |
7.9 (20) |
5.9 (15) |
2.2 (5) |
0.3 (1) |
0 (0) |
0 (0) |
0 (0) |
0 (0) |
0.6 (2) |
8.3 (21) |
16.8 (43) |
55.5 (141) |
| Average high °F (°C) | 35.7 ( 2.1) |
44.4 ( 6.9) |
55.8 (13.2) |
74.2 (23.4) |
77.5 (25.3) |
82.9 (28.3) |
87.5 (30.8) |
90.9 (32.7) |
75.7 (24.3) |
55.0 (12.8) |
45.8 ( 7.7) |
26.0 (-3.3) |
62.8 (17.1) |
| Average low °F (°C) | 22.2 (-5.4) |
23.5 (-4.7) |
27.3 (-2.6) |
34.4 (1.3) |
38.7 (3.7) |
42.9 ( 6.0) |
45.7 ( 7.6) |
44.3 ( 6.8) |
37.3 ( 2.9) |
33.7 ( 1.0) |
30.9 (-0.6) |
10.1 (-12.2) |
32.6 ( 0.3) |
| Precipitation inches (mm) |
2.19 (56) |
1.41 (36) |
3.00 (76) |
1.48 (38) |
2.26 (57) |
1.85 (47) |
1.04 (26) |
0.30 ( 8) |
0.61 (14) |
4.84 (116) |
2.56 (72) |
1.06 (28) |
22.60 (574) |
| Snowfall inches (cm) |
19.1 (48) |
2.1 (5) |
4.1 (10) |
0.0 (0) |
0.0 (0) |
0.0 (0) |
0.0 (0) |
0.0 (0) |
0.0 (0) |
0.0 (0) |
2.9 (7) |
11.8 (30) |
40.0 (102) |
| Average high °F (°C) | 27.6 (-2.5) |
36.3 ( 2.4) |
48.6 ( 9.2) |
59.3 (15.2) |
75.0 (23.9) |
84.5 (29.2) |
96.9 (36.0) |
95.1 (35.0) |
79.3 (26.3) |
58.9 (15.0) |
39.2 ( 4.0) |
28.0 (-2.2) |
60.9 (16.1) |
| Average low °F (°C) | 9.4 (-12.5) |
14.5 (-9.7) |
26.0 (-3.4) |
29.6 (-1.3) |
38.1 ( 3.4) |
42.3 ( 5.7) |
45.9 ( 7.7) |
46.3 ( 7.9) |
38.8 ( 3.8) |
27.6 (-2.5) |
25.8 (-3.5) |
12.8 (-10.6) |
29.8 (-1.2) |
| Precipitation inches (mm) |
1.37 (35) |
3.12 (79) |
2.32 (59) |
3.28 (83) |
3.66 (93) |
0.43 (11) |
0.00 (0) |
0.00 (0) |
0.29 (7) |
1.14 (29) |
2.87 (73) |
1.43 (36) |
19.91 (506) |
| Snowfall inches (cm) |
13.7 (35) |
19.1 (48) |
6.4 (16) |
0.0 (0) |
0.0 (0) |
0.0 (0) |
0.0 (0) |
0.0 (0) |
0.0 (0) |
0.7 (2) |
15.4 (39) |
16.8 (43) |
72.0 (183) |
| Average high °F (°C) | 36.9 ( 2.7) |
38.2 ( 3.5) |
49.8 ( 9.9) |
60.1 (15.6) |
82.0 (27.8) |
81.3 (27.4) |
95.0 (35.0) |
90.8 (32.7) |
74.5 (23.6) |
60.3 (15.7) |
41.6 ( 5.3) |
||
| Average low °F (°C) | 21.5 (-5.8) |
12.5 (-10.9) |
24.2 (-4.3) |
30.1 (-1.1) |
41.8 ( 5.5) |
41.2 ( 5.1) |
46.5 ( 8.1) |
45.9 ( 7.7) |
37.8 ( 3.2) |
29.1 (-1.6) |
24.4 (-4.2) |
||
| Precipitation inches (mm) |
3.60 (91) |
1.77 (45) |
2.68 (68) |
2.16 (55) |
0.94 (24) |
1.38 (35) |
0.08 (2) |
0.16 (4) |
0.88 (22) |
1.39 (35) |
1.43 (36) |
||
| Snowfall inches (cm) |
25.0 (64) |
16.6 (42) |
21.3 (54) |
0.6 (2) |
0.0 (0) |
0.0 (0) |
0.0 (0) |
0.0 (0) |
0.0 (0) |
0.0 (0) |
3.4 (9) |
||
| Month | Jan | Feb | Mar | Apr | May | Jun | Jul | Aug | Sep | Oct | Nov | Dec | Year |
| Source: My records here 2002-2018 | |||||||||||||
  My Weather Charts for here on Lambert Creek My Weather Charts for here on Lambert Creektemperatures for air and ground precipitation, snowfall, and heat index charts 19 year chart of snowtel depth on the Kettle Crest | |||||||||||||
![[Home]](images/home.gif)
|
![[Republic photos]](images/20110501_S35SW_LambertMtn-CopperButte_SE_7215-t60.jpg)
|
![[e-Mail me]](images/mbicon.gif)
|
| wildfireLinks.html | Updated 2024.Jul.24 12:00 |