|
|
Stewart's Corral Evaluating Electrosmog meters |
page 33 visitor # |
|
|
Stewart's Corral Evaluating Electrosmog meters |
page 33 visitor # |
| Index | About Me and EHS | ||
| Introduction and Awareness. Real or imagined About me, part 1 How it started About me, part 2 Ongoing saga |
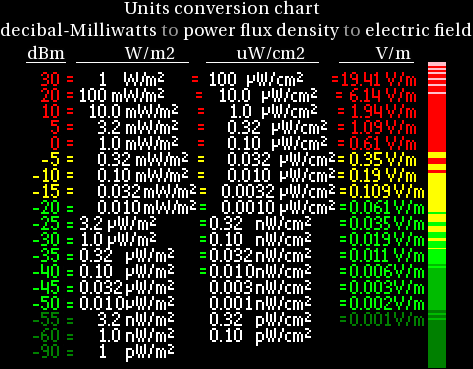
Searching for EM-Smog Meter Evaluation Conversion chart and entry table Features to Look For Specifications Emissions More Meters Evaluation in Urban Measuring a cell phone |
Indoor Equipment Evaluation part 3 Measuring cellular and smartphones part 8 Spectrum analysis graphs part 7 |
 LIBRARY— LIBRARY—Health Links part 4, Book and video recommendations, Top research picks. |
|
A group of German doctors, led by Dr. Cornelia Waldmann Selsam found that 70% of patients did not experience health effects if the microwave field levels they lived in were less than 0.06 V/m, whereas when these levels rose to 0.2 V/m and above, only 5-6% of their patients did not experience health effects. She concluded that in order to protect the general public, microwave levels should be below 0.06 volts per meter (V/m). More details can be found at http://www.powerwatch.org.uk/news/20050722_bamberg.asp Research studies by Hardell (2003, 2004, 2005, 2006, 2009), Mild (2007), and Kundi (2009), among others, have found a link between mobile phone and digital cordless phone use and an increased risk of developing brain tumours and non-Hodgkin's lymphoma, especially in younger age groups. Mobile phone use has also been linked to dementia-like changes in the brain (Salford 2003, Eberhardt 2008), and with fertility problems (Fejes 2005, Erogul 2006, Yan 2007, Agarwal 2008). Many people have wireless enabled internet access for their computer at home. These can emit RF radiation that can travel across property lines to their neighbors' homes. The attendant radiation is similar to that of a nearby high-power mobile phone mast. |
| -- Excerpt from emfields.org |
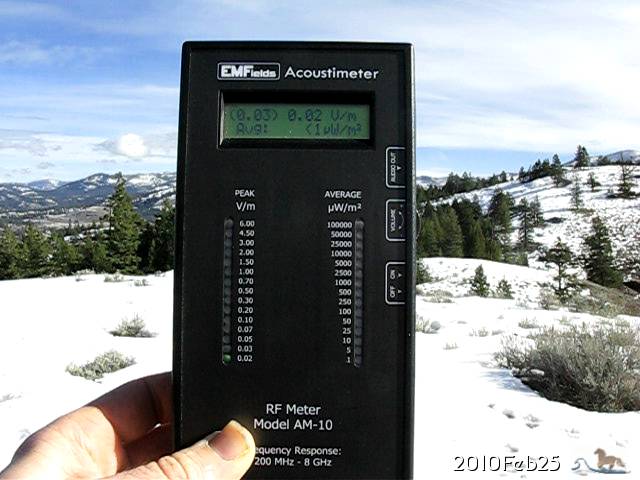
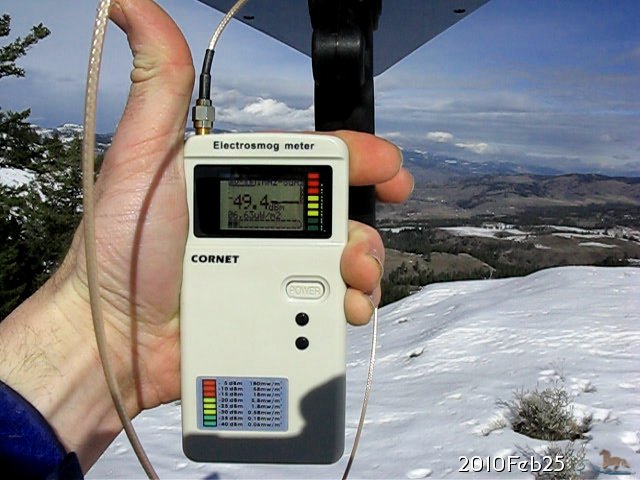
Searching for Electro-Magnetic Smog - Rural OutdoorsIn 2009.Dec, I purchased a new meter from EMFields, the ACOUSTIMETER AM-10, seeking to replace the (highly sensitive) ZAP CHECKER ZC180 whose analog needle gets stuck sometimes. (It's 4 years old) They said their current models are better about that problem, but I am not inclined to purchase another from them, while they only have analog needles. I was programmed to be a bean counter, so I like numbers to quantify the situation. Plus, it is important to gather evidence, or have proof not dependant on my word alone.What a surprise! a hot spot in the (southwest) neighborhood, right where I have been getting headaches when passing by. |
, and 4 uW/m2 average. Taken 2010-Feb-02 along 205 Lambert Creek Rd.")
|
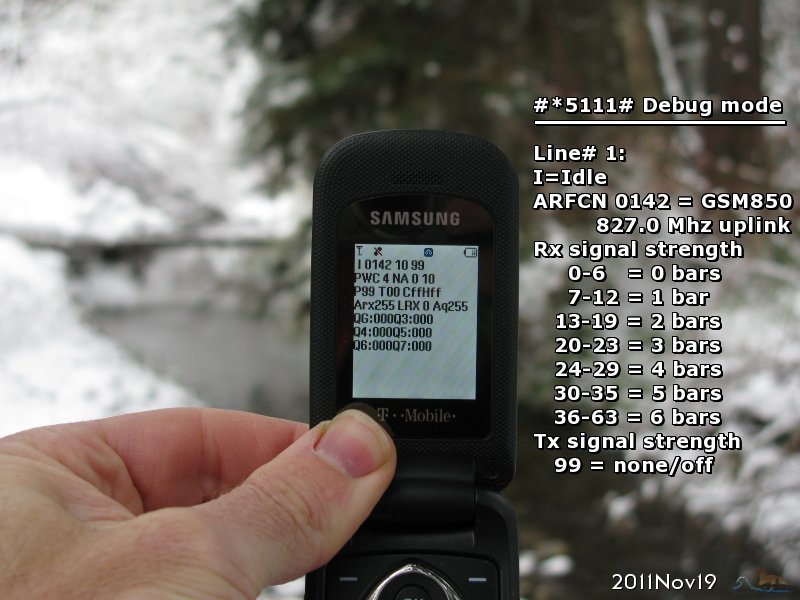
I was finally able to say, what was bothering me (probably for the last year) was a beacon, transmitting 10 times per second. Audio recording: 5 seconds 10Kb [mp3] (includes in the background, the sound of my horse walking.) The beacon sounds like a jackhammer, and clearly identifies the type of transmitter. ————Skip meters to stay with my health story.———— |
 Click to enlarge
 Click to enlarge
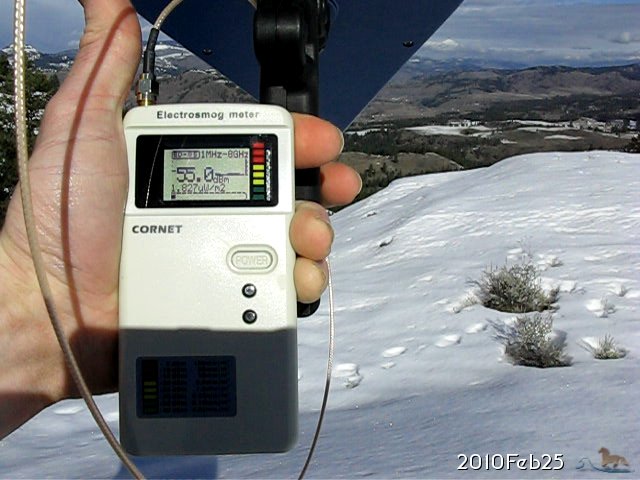 Click to enlarge
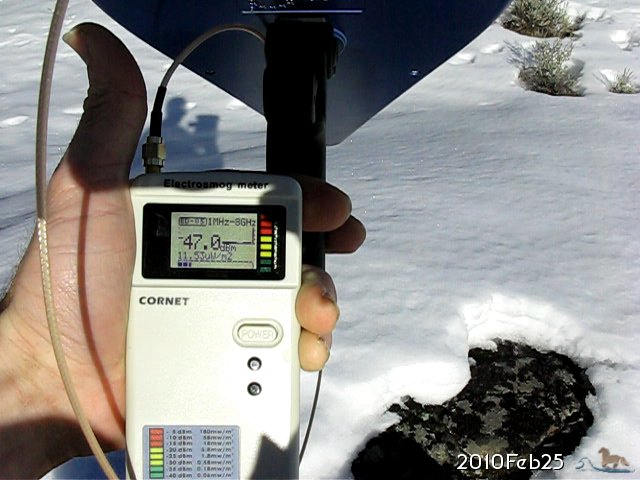 Click to enlarge
 Click to enlarge
 Click to enlarge
 Click to enlarge
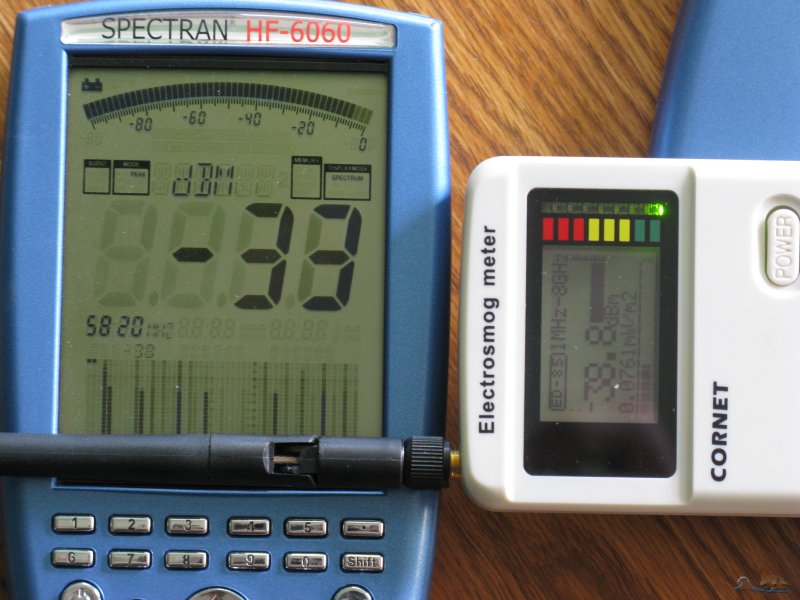 Click to enlarge
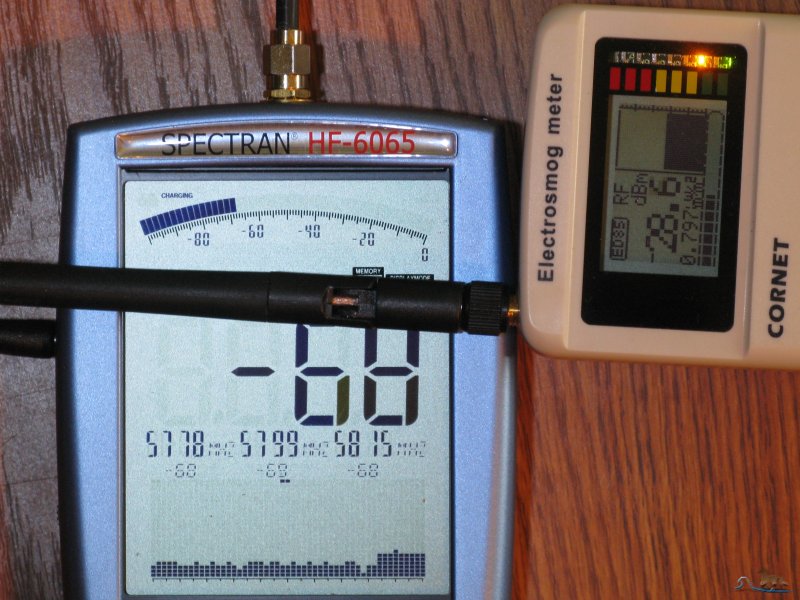 Click to enlarge
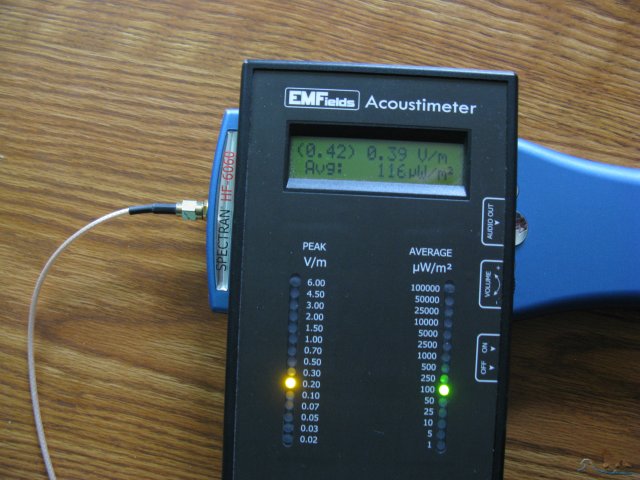 Click to enlarge
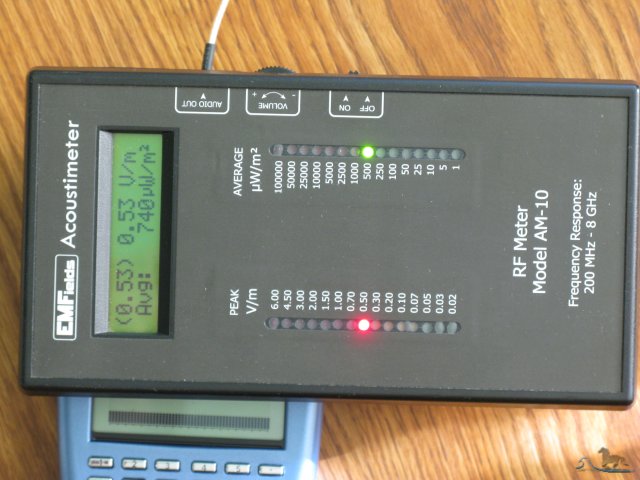 Click to enlarge
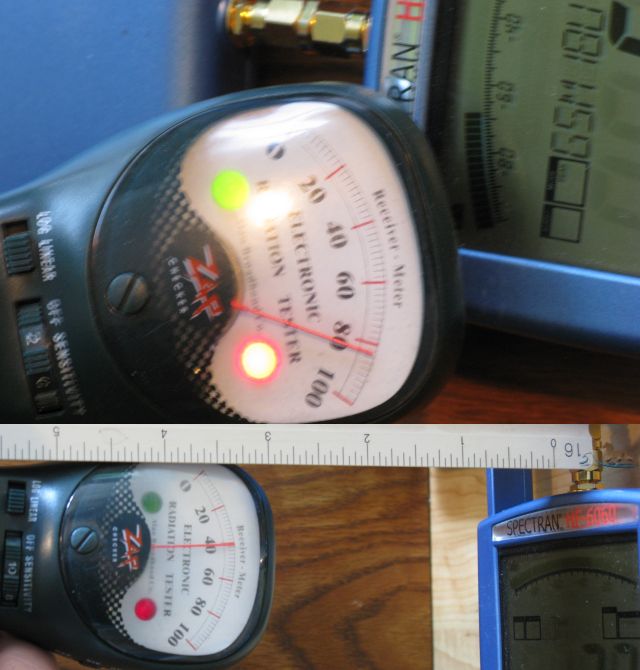 Click to enlarge
|
| ||||||||||||||||||||||||||||||||||||||||||||||||||||||||||||||||||||||||||||||||||||||||||
Adding Low frequency Magnetic and Electric field scales, and establish a color scale, consistent with the most meters and safety scales:
| ||||||||||||||||||||||||||||||||||||||||||||||||||||||||||||||||||||||||||||||||||||||||||
|
HF Broadband Meters (in alphabetical order) | Frequency Range |
# of Axis (1=directional) |
Sensitivity Threshold | Features | MSRP |
|
9CI Safe and Sound Pro New for 2019 |
200 MHz - 12 GHz 650 MHz - 10 GHz (± 6dB) | 1 |
specs don't say, I measure 0.350 µW/m² 0.0115 V/m |
⇑ 2 AA lasts 15-18 hours Accepts USB micro-B power. Top rating |
$ 370 here |
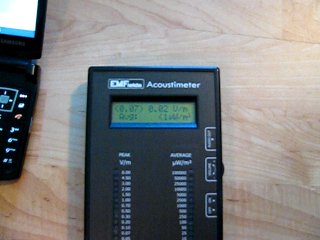
| Acoustimeter AM-10 | 200 MHz - 8 GHz |
both 1 and 2 |
0.02 V/m (numeric display) 0.001 mW/m² ultra-sensitive audio speaker |
• lacking on the low end. Shows Peak. Shows Current at same time as Peak and Average. for an internal antenna. but does not fit in most pockets. 2 AA 20 hours |
£ 243 here |
|
AlphaLab Inc. TriField Meter TF2 New for 2018 |
Magnetic Gauss meter and Electric Field meter 40 Hz - 100 kHz plus RF 20 MHz - |
3 Mag 1 ELF 1 RF | M 0.1 mG - 100 mG E 1 - 1000 V/m RF 0 - 20 mW/m² |
⇑ 9V | $ 165 |
| Cornet ED-15SA | 100 MHz - 3 GHz | 2 |
0.026 V/m 0.0018 mW/m² |
↑ 9V >20 hours | $ 115 |
|
Spectrum analysis: 2.4 - 2.5 GHz |
0.000003 V/m 0.000000000025 mW/m² | ||||
| Cornet ED-7 | 300 MHz - 3 GHz | 2 |
0.026 V/m 0.0018 mW/m² |
↑ 9V | $ 39 |
| Cornet ED-75 |
100 MHz - 6 GHz plus Low-EMFreq: 50 Hz - 15 kHz Gauss meter |
2 |
0.013 V/m 0.0005 mW/m² 0.5 mG - 600 mG |
⇑ 9V | $ 132 |
|
Cornet ED-78S |
100 MHz - 8 GHz plus Low-Freq: 50 Hz - 10 kHz Gauss meter |
2 |
0.014 V/m 0.0005 mW/m² 0.1 mG - 600 mG |
⇑ 9V | $ 169 |
| Cornet ED-85 |
1 MHz - 8 GHz included whip antenna: 600 MHz - 5.8+ GHz |
2 |
0.026 V/m 0.0018 mW/m² |
⇑ 9V >20 hours | $ 180 |
| Cornet ED-85-EXS |
1 MHz - 8 GHz included whip antenna: 400 MHz - 6 GHz |
2 |
0.0083 V/m 0.000187 mW/m² |
⇑ 9V |
$ 186 here |
|
Cornet ED-88T Tri-Mode New for 2016 |
100 MHz - 8 GHz plus Low-Freq: 50 Hz - 10 kHz Gauss meter plus Electric Field |
2 |
0.014 V/m 0.0005 mW/m² 0.1 - 600 mG 10 - 1000 V/M |
⇑ Highest rating by independant tests for low-price meters. 9V Accepts USB micro-B power. Top rating |
$ 189
here $ 179 sale price and review |
| Canary Hotspotter HS-20 |
WiFi 802.11b/g/n 2.4 GHz - 2.5 GHz | 2 |
ultra-sensitive exceeding Acoustimeter speaker |
⇑ 2 AAA | $ 49 |
|
ENV RD-10 New for 2018 |
100 MHz - 8 GHz plus Magnetic 50 Hz - 10 KHz Gauss meter and Electric Field meter |
_ RF _ Mag _ ELF |
0.0137 V/m 0.0005 mW/m² 0.1 mG - 50 mG 2 - 1000 V/m |
⇑ LiPo lasts 8-10 hours | $ 160 |
|
Latnex AF-5000 New for 2021 |
50 MHz - 10 GHz plus Magnetic 50 Hz - 60 Hz Gauss meter and Electric Field meter |
1 RF 3 Mag 1 ELF |
0.0002 mW/m² advertised sensitivity not realized 0.01 mG - 2000 mG 50 - 2000 V/m |
↑ 3 AAA lasts 8 hours | $ 210 here |
|
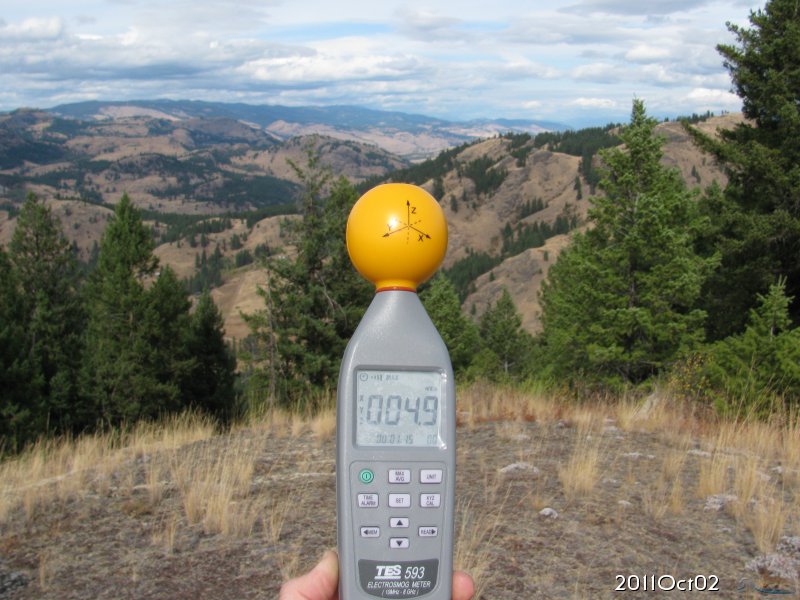
TES 593 same as Extech 480846 | 10 MHz - 8 GHz | 3 |
0.0015 V/m 0.00001 mW/m² advertised specs not realized |
⇑ 9V lasts 2-5 hours | $ 499 |
| TriField Meter EX100 | 50 MHz - 3 GHz | 3 |
6.1 V/m 98.7 mW/m² |
? 9V | $ 130 |
| Zap Checker 180 | 10 MHz - 4.5 GHz | 1 |
ultra-sensitive (un-calibrated) |
⇑ 2 AA 80 hours | $ 159 |
|
Zap Checker 190B Enhanced | 1 MHz - 8 GHz | 1 |
ultra-sensitive (un-calibrated) |
? 2 AA | $ 369 |
| LF Meter | Frequency Range |
# of Axis (1=directional) |
Sensitivity / Measurement Range | Features | MSRP |
| DER EE DE-1007 | 30 Hz - 400 Hz | 1 | 0.1 mG - 200 mG |
⇑ 9V | $ 99 |
|
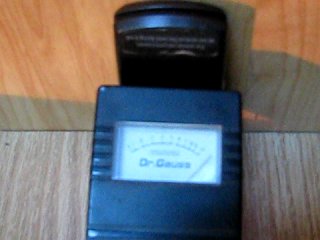
Dr. Gauss Meter aka Gauss Master | 40 Hz - 2000 Hz | 1 | 0.1 mG - 10 mG |
⇑ 9V | $ 35 |
|
Gigahertz Solutions ME 3030B | 16 Hz - 2000 Hz | 1 |
E 1 V/m - 1999 V/m M 1 nT / 0.01 mG - 1999 nT |
⇑ Ideal range would be up to 10KHz. 9V | $ 125 |
| HF Spectrum Meter | Frequency Range |
# of Axis (1=directional) |
Sensitivity / Measurement Range | Features | MSRP |
|
Aaronia Spectran HF-6065 version 4 |
10 MHz - 6 GHz HyperLog antenna: 700 MHz - 6 GHz |
2 1 |
0.00000061 V/m 0.000000000001 mW/m² |
⇓ creates too much noise, and is of poor visual quality.. Very slow LCD crystals, poor contrast. proprietary+ext | € 1000 |
|
RF Explorer Model 3G-24G Combo |
2.3 - 2.5 GHz expansion module: 15 MHz - 2700 MHz |
2 |
0.00000061 V/m 0.000000000001 mW/m² |
↓ Internal LiPo 16 hours |
$ 289 here |
| Acoustimeter AM-10 | Cornet ED-7 | |
| Colville | 34 seconds 270Kb [mp3] | 16 seconds 128Kb [mp3] |
| Spokane | 49 seconds 385Kb [mp3] | 32 seconds 250Kb [mp3] |
| neighbor #1 | 5 seconds 40Kb [mp3] | 5 seconds 37Kb [mp3] |
| Backlight | Battery draw (milliAmps) |
| off | 39.4 |
| ON | 68.4 |
| CORNET ED-85-EXS | Orange Backlight | Sound | Battery draw (milliAmps) |
| Power ON | off | off | 32.9 |
| Power ON | ON | off | 37.5 |
| Power ON | off | ON | 35.3 |
| Power off | 0.0 |
| CORNET ED-78S | Green Backlight | Sound | Battery draw (milliAmps) |
| Power ON | off | off | 33.3 |
| Power ON | ON | off | 39.5 |
| Power ON | off | ON | 36.7 |
| Power off | 0.0 |
| CORNET ED-88T | White Backlight | Sound | Battery draw (milliAmps) |
| Power ON | off | off | 48.1 |
| Power ON | ON | off | 59.9 |
| Power ON | off | ON | 50.8 |
| Power ON | ON | ON | 62.8 |
| Power off | 0.0 |
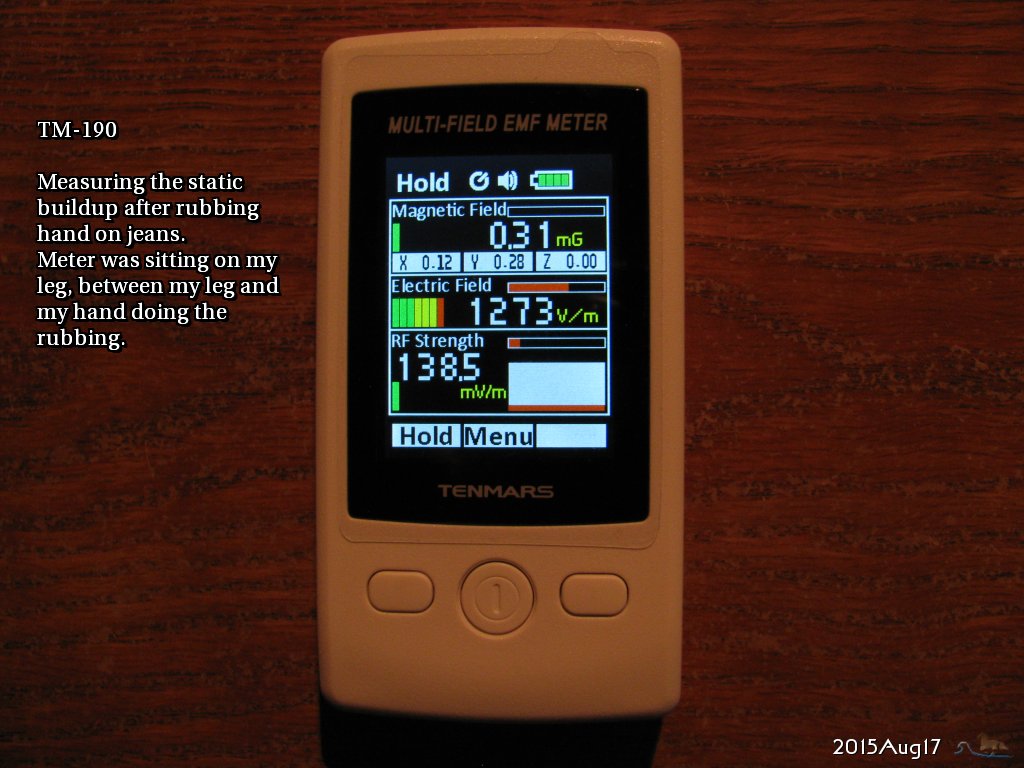 static charge if I rub my hand on my jeans. Also picking up magnetic field lines of force when Moving across them. The display is very informative, since it incorporates a large TFT LCD display. The RF section displays a histogram 20 columns wide, each column representing each measurement taken 1.9 seconds apart. That totals 38 seconds of history at a glance. It will beep an alarm if any of the 3 measurements exceed "the red line" which can be very useful to have in your pocket. But after further testing, I find it has some deficiencies as well. First, the display is virtually unreadable in sunlight. 2. The minimum RF level is reading consistantly high, it reads

 0.125 V/m
where all five other meters read below 0.02 V/m.
So although it advertises sensitivity down to 0.03 V/m, I have never seen it below 0.0693 V/m, and that was at boot up one time. The minimum is usually a bit higher. After it gets running, I have never seen it below 0.1212 V/m. It usually bottoms at 0.1299 V/m. This is clearly the noise floor of the meter itself. So while at first glance it appears to have good sensitivity, as the RF levels wiggle up and down around various equipment I've tested it on. But after driving into town, and comparing it's results with other meters, where the cellular whine appears and becomes strong, this meter shows little to no change, as it increases to 0.185 V/m at the same time other meters rise to 0.18 V/m and reach an even footing. Then when in passing thru stronger parts of towns, I see it respond much better, so the deficiency appears to only be in measuring weak signals. This level of sensitivity may be okay for noisy environments, but is not very impressive to me. In fact I should use a stronger word in the negative this time. 3. It only shows Current levels, and does not show Max Peak. This could be added in firmware, so is an issue that may improve in time (but don't hold your breath). 4. It puts out a significant magnetic field, so holding it may not feel good for sensitive people. On the flip side, it puts out no RF emissions. Another good point, is that it can be plugged into USB to provide external power, and it draws the same amount as when on battery power.
0.125 V/m
where all five other meters read below 0.02 V/m.
So although it advertises sensitivity down to 0.03 V/m, I have never seen it below 0.0693 V/m, and that was at boot up one time. The minimum is usually a bit higher. After it gets running, I have never seen it below 0.1212 V/m. It usually bottoms at 0.1299 V/m. This is clearly the noise floor of the meter itself. So while at first glance it appears to have good sensitivity, as the RF levels wiggle up and down around various equipment I've tested it on. But after driving into town, and comparing it's results with other meters, where the cellular whine appears and becomes strong, this meter shows little to no change, as it increases to 0.185 V/m at the same time other meters rise to 0.18 V/m and reach an even footing. Then when in passing thru stronger parts of towns, I see it respond much better, so the deficiency appears to only be in measuring weak signals. This level of sensitivity may be okay for noisy environments, but is not very impressive to me. In fact I should use a stronger word in the negative this time. 3. It only shows Current levels, and does not show Max Peak. This could be added in firmware, so is an issue that may improve in time (but don't hold your breath). 4. It puts out a significant magnetic field, so holding it may not feel good for sensitive people. On the flip side, it puts out no RF emissions. Another good point, is that it can be plugged into USB to provide external power, and it draws the same amount as when on battery power.| TM-190 | Backlight | Battery draw (milliAmps) |
| Power ON | Low | 65.3 - 71.2 |
| Power ON | Medium | 75.8 - 81.9 |
| Power ON | High | 91.9 - 98.4 |
| Power off | 0.0 |
| TF2 | White Backlight | Sound | Battery draw (milliAmps) M & E - RF |
| Power ON | off | off | 13.9 - 15.6 |
| Power ON | ON | off | 28.4 - 30.1 |
| Power ON | off | ON | 16.7 - 18.5 |
| Power ON | ON | ON | 31.0 - 32.9 |
| Power off | 0.0 |
| Meter | 100 µs | 50 µs | 20 µs | 10 µs | 5 µs | 3 µs |
| Acoustimeter | Pass | Pass | Fail | |||
| Cornet ED88T | Pass | Pass | Fail | |||
| Safe and Sound | Pass | Pass | Pass | Pass | Pass | Pass |
| TF2 | Fail | FAILS to detect any pulse faster than 9,000 µs | ||||
|
The AM-10 uses a 6400 sample / 250ms averaging window. Sampling rate is 25,600 samples/second (40 µs sample width). Narrow pulses produce lower PEAK readings, as the pulse is narrower than the sampling window. The narrower averaging window tends to fluctuate more when measuring high power/high duty sources. The AM-10 is an excellent meter, and for most current RF sources, this sample width works very well. The SaS Pro has high sampling rate/narrow pulse detection to be 5G waveform compatible. The SaS Pro uses four 65,536 sample / 325 ms averaging windows in a moving average filter (262,144 samples / 1300 ms total window width). Sampling rate is 200,000 samples/second (5 µs sample width). This high sampling rate improves the PEAK accuracy for narrow pulses, as it reduces the likelihood of a pulse being narrower than the sampling window (diluting the measurement). The wide averaging window improves AVG stability for higher power/high duty sources (wireless data links, 5G data streams, ultrawideband (UWB) wireless). |
| Subject of test | AM-10 | ED88Tplus | SSP 1 | TF2 | ENV RD-10 | AF-5000 |
| Distant towers on Franson Peak, 7 miles away indirect | 0.02 V/m | 0.0005 mW/m² 0.0137 V/m | 0.400 µW/m² 0.0123 V/m | 0.000 mW/m² | 0.0005 mW/m² 0.0137 V/m | 0.000 µW/m² |
| Excellent audio: detailed cellular whine plus digital data | Medium quality audio: whine present | Weak audio: faint bass thumping | ||||
| #1 Neighbor Wifi, Dect phone, Cellular hot spot, 200 feet away. | 0.03 V/m | 0.0006 mW/m² 0.0150 V/m | 1.710 µW/m² 0.0254 V/m | 0.000 mW/m² | 0.0005 mW/m² | 0.000 µW/m² |
| Excellent audio: moving along the fenceline, Wifi beacon and Dect buzz are very distinct at various focal points. | Weak but distinct audio: buzzing, wifi beacon present | Strong audio: buzzing, bass thumping includes Wifi beacon, and in selected spots with line of sight between the trees the cellular whine is present. | ||||
| #2 Neighbor Wifi, Dect phone, 327 feet away. | 0.02 V/m | 0.0005 mW/m² 0.0137 V/m | 0.812 µW/m² 0.0175 V/m | 0.000 mW/m² | 0.0005 mW/m² | 0.000 µW/m² |
| Excellent audio: mostly buzzing (new DECT phone), is louder than the Wifi now. | Medium quality audio | Strong audio: loud buzzing, thumping of wifi beacon. |
 Youtube. It includes the Acoustimeter AM-10, Cornet ED-88T, ENV RD-10, Trifield TF2, Safe and Sound Pro, GigaHertz ME-3030B, Dr. Gauss, ENV RD-10, and a few others low on my list. This includes the replacement TF2, which performs much better than my first edition.
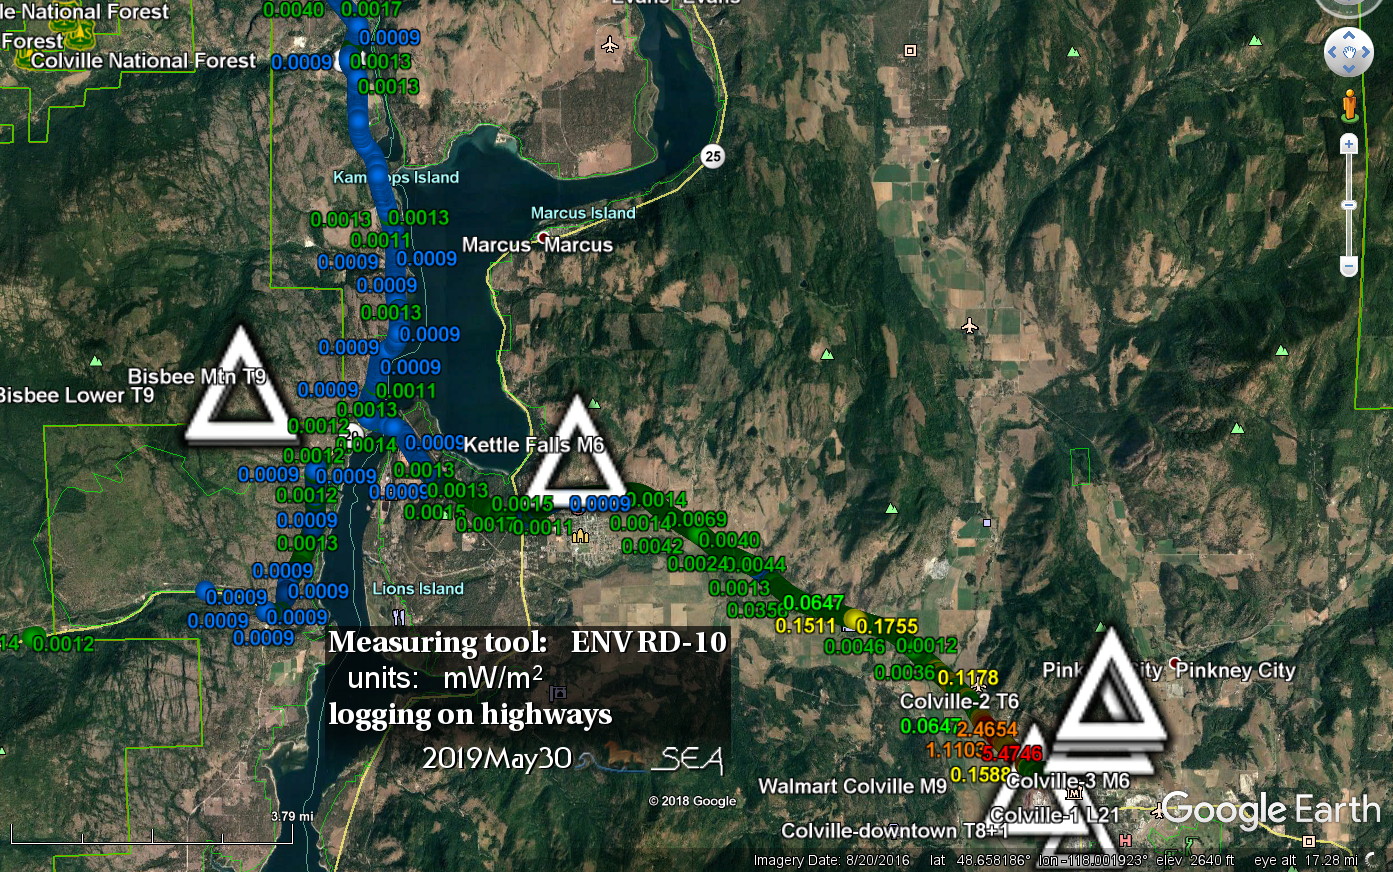
|
All of my recommendations are based 100% on my evaluation and personal use of these meters. At no time has any company, manufacturer, or vendor ever paid me for the work I do. Zero. Neither have I ever received any test models, production models, or any unannounced upgrades. The only upgrade I have got, I requested and paid for. Nobody tells me when new models or upgrades become available. Any and all links for purchasing the meters above, are provided solely for your convenience, and may not be the best prices at the time you read this. |
| device being measured (this column down) | device doing the measuring | |||||||||
|
TF2 at zero distance | Safe and Sound Pro |
Acoustimeter at zero distance, and distance for audio to disappear |
Zap Checker 180 at zero distance, and distance to get 5 at 10 |
Cornet ED-75/85 at zero distance |
TES-593 at zero distance |
GaussMeter at zero distance, and distance to get <= 0.2mG |
||||
|
9CI Safe and Sound Pro |
|
0.02 V/m 0.5 inch (1 cm) |
10 at sensitivity 9 50 at sensitivity 8 1 inch (2 cm) | Below thresholds | Below background |
front:
10 mG 3 inches (8 cm) | ||||
| back: 5mG | ||||||||||
| Acoustimeter AM-10 |
|
0.545 µW/m² 0.014 V/m 1.5 in. (4 cm) |
n/a 12 inches (30 cm) from AM radio |
100 at sensitivity 9 60 at sensitivity 8 2 inches (5 cm) | Below thresholds | Below background |
3 mG 3 inches (8 cm) |
|||
| Alpha Labs Trifield TF2 | 0.639 µW/m² 0.016 V/m 1 in. (3 cm) |
< 0.02 V/m no audio detected |
60 at sensitivity 10 1.5 inch (4 cm) | Below thresholds | Below background |
0.15 mG (background) | ||||
| Canary Hotspotter HS-20 |
|
0.412 µW/m² 0.012 V/m |
< 0.02 V/m one brief pop of audio detected |
70 at sensitivity 10 9 at sensitivity 8 1/4 inch (0.6 cm) | Below thresholds | Below background |
0.9 mG only at top half 2 inches (5 cm) | |||
| Cornet ED-15SA |
|
0.412 µW/m² 0.012 V/m |
< 0.02 V/m some audio detected in SA mode |
60 at sensitivity 9 5 at sensitivity 8 1/4 inch (0.6 cm) | Below thresholds | Below background | 0.2 mG | |||
| Cornet ED-7 |
< 0.02 V/m no audio detected |
2 at sensitivity 10 | Below thresholds | Below background |
>10 mG (1 µT) 5 inches (13 cm) | |||||
| Cornet ED-85 |
< 0.02 V/m no audio detected |
90 at sensitivity 9 8 at sensitivity 8 1/2 inch (1.3 cm) | Below thresholds | Below background | 0.17 mG | |||||
| Cornet ED-85-EXS |
|
0.396 µW/m² 0.012 V/m |
< 0.02 V/m some audio detected from new display |
10 at sensitivity 10 1/2 inch (1.3 cm) | Below thresholds | Below background |
Sound ON: >10 mG 3.5 inches (9 cm) |
|||
| Sound off: 0.17 mG | ||||||||||
|
Cornet ED-88T Cornet ED-88T plus |
|
0.614 µW/m² 0.015 V/m 1 in. (3 cm) |
< 0.02 V/m |
10 at sensitivity 10 1/2 inch (1.3 cm) | Below thresholds | Below background |
Sound ON: 0.2 mG 2.5 inches (6 cm) | |||
| Sound off: 0.15mG | ||||||||||
| ENV RD-10 |
|
0.429 µW/m² 0.013 V/m |
< 0.02 V/m no audio detected |
100 at sensitivity 8 55 at sensitivity 6 1.5 inch (4 cm) | Below thresholds | 0.0038 V/m |
0.15 mG (background) |
|||
| GQ EMF-390 |
|
0.812 µW/m² 0.017 V/m |
0.02 V/m 2.5 inches (7 cm) |
90 at sensitivity 7 40 at sensitivity 6 3 inches (8 cm) |
7.7 mV ADC 0.0139 V/m 0.0005 mW/m² | 0.0040 V/m |
0.8 mg 1 inch (3 cm) | |||
| Latnex AF-5000 |
|
2.14 µW/m² 0.028 V/m 1.75 in. (5 cm) |
0.03 V/m 1.25 inch (3 cm) |
100 at sensitivity 6 40 at sensitivity 5 1.5 inch (3 cm) |
8.0 mV ADC 0.015 V/m 0.0006 mW/m² | 0.0042 V/m |
0.8 mG 1.25 inch (3 cm) | |||
| TES-593 |
|
1.13 µW/m² 0.021 V/m 1.75 in. (5 cm) |
< 0.02 V/m no audio detected |
90 at sensitivity 8 57 at sensitivity 7 2 inches (5 cm) | Below thresholds |
0.25 mG 0.25 inches (0.5 cm) |
||||
| TM-190 |
|
0.614 µW/m² 0.015 V/m 4 in. (10 cm) |
< 0.02 V/m no audio detected |
50 at sensitivity 5 100 at sensitivity 6 4 inches (10 cm) | Below thresholds | Below background |
>10 mG (1 µT) 4 inches (10 cm) | |||
| Zap Checker 180 |
|
0.396 µW/m² 0.012 V/m |
< 0.02 V/m no audio detected | n/a | Below thresholds | Below background |
0.15 mG (background) | |||
| DER EE DE-1007 |
|
0.484 µW/m² 0.014 V/m 0.5 in. (1nbsp; cm) |
< 0.02 V/m no audio detected |
2 at sensitivity 10 | Below thresholds | Below background |
0.15 mG (background) | |||
| Dr. Gauss Meter |
|
0.381 µW/m² 0.012 V/m |
< 0.02 V/m no audio detected |
2 at sensitivity 10 | Below thresholds | Below background | n/a | |||
| Gigahertz ME 3030B |
|
0.396 µW/m² 0.012 V/m |
< 0.02 V/m no audio detected |
2 at sensitivity 10 | Below thresholds | Below background |
0.15 mG (background) | |||
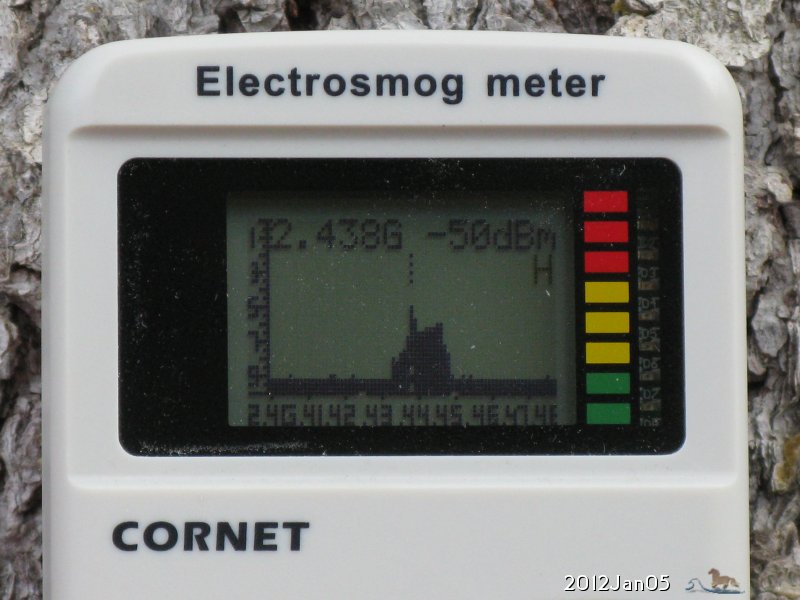
| Spectran HF-6060 ver.2 |
0.42 V/m = 0.446 mW/m² 12 feet (366 cm) |
82 at sensitivity 1 |
0.076 mW/m² -38.3 dBm | |||||||
| Spectran HF-6065 ver.4 |
|
180 µW/m² 0.261 V/m 6 feet (183 cm) |
0.56 V/m = 0.832 mW/m² 8 feet (244 cm) |
100 at sensitivity 1 up to 7 feet (213 cm) |
0.797 mW/m² -28.6 dBm | 0.2023 V/m |
4.7 mG 6 inches (15 cm) | |||
| RF Explorer 2.4G |
|
0.780 µW/m² 0.017 V/m 1.5 in. (4 cm) |
0.03 V/m 1.5 inches (4 cm) |
50 at sensitivity 10 40 at sensitivity 9 1 inch (3 cm) | Below thresholds |
0.0031 V/m at background |
2.0 mG 1 inch (3 cm) | |||
| RF Explorer 2.4G plus 3G Combo | 0.27 V/m = 0.193 mW/m² |
90 at sensitivity 7 35 at sensitivity 6 9 inches (23 cm) |
0.095 mW/m² 0.18 V/m | 0.1740 V/m |
3.5 mG 4 inches (10 cm) | |||||
| RF Explorer 6G plus 3G Combo |
|
82.7 µW/m² 0.177 V/m 6 feet (183 cm) |
0.16 V/m 0.068 mW/m² 7 feet (213 cm) |
55 at sensitivity 7 40 at sensitivity 6 9 inches (23 cm) |
0.382 mW/m² 0.38 V/m | 0.1330 V/m |
2.0 mG 1 inch (3 cm) | |||
| RF Explorer 6G |
0.09 V/m 16 inches (41 cm) |
18 at sensitivity 10 1 inch (3 cm) |
0.004 mW/m² 0.04 V/m | 0.0046 V/m |
7.0 mG 3 inches (8 cm) | |||||
| device being measured (this column down) |
TF2 at zero distance | Safe and Sound Pro |
Acoustimeter at zero distance, and distance for audio to disappear |
Zap Checker 180 at zero distance, and distance to get 5 at 10 |
Cornet ED-75/85 at zero distance |
TES-593 at zero distance |
GaussMeter at zero distance, and distance to get <= 0.2mG | |||
Here is an exception to my last paragraph... I am adding a section to this page to show normal use in normal areas. Thus going near noisy environments intentionally, or kind of, forced into it...
This is from driving through Airway Heights near Spokane, on Hwy 2:
 Click to enlarge
This shows a steady level of activity around -38 dBm, then a spike up to -5 dBm (182.74 mW/m²) when passing an unmarked WSP patrol car, and in the last 7 seconds, the background level went up to -29 dBm, holding fairly steady until I pressed the Hold button at -30 dBm (0.564 mW/m²). The ability to show the last 16 seconds (32 bars) on a graph is Very useful!
|
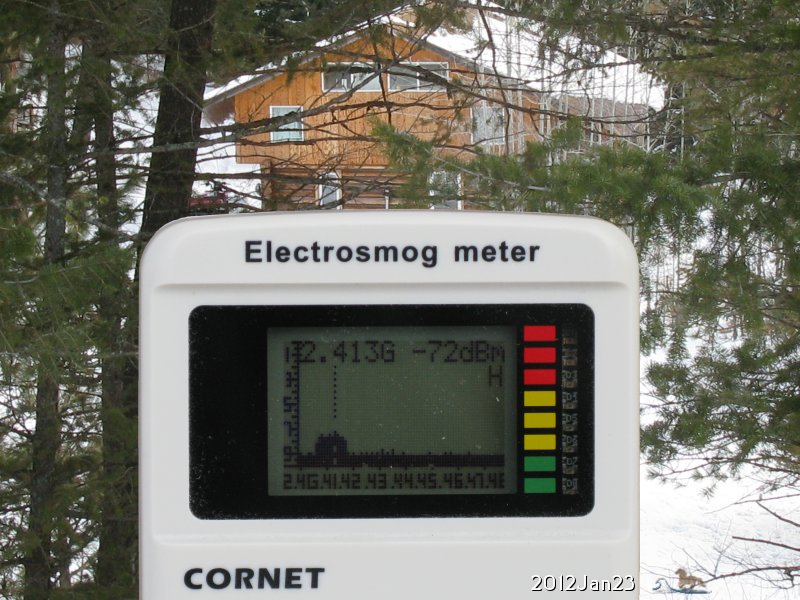
When I felt the spike of pain, I glanced at the meter, and pressed the Hold button.
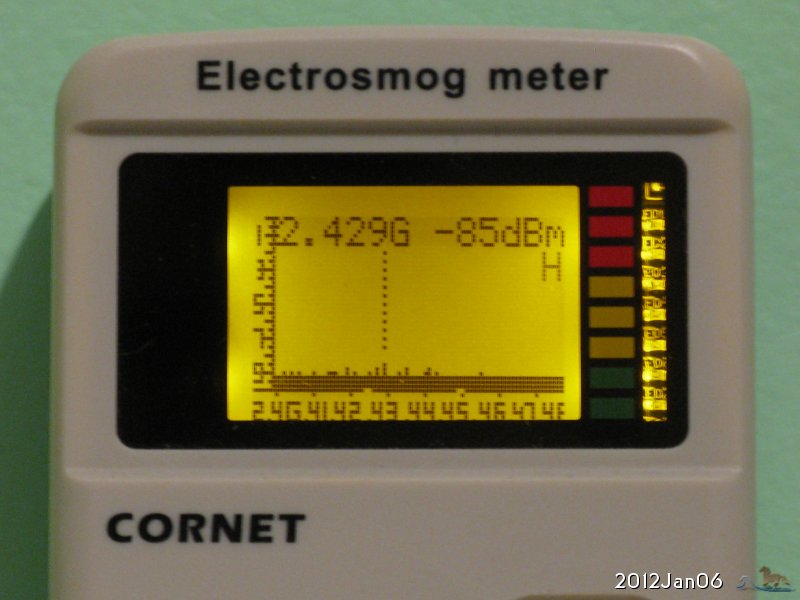
Later, after I was Out of the city, I was then able to take this picture. Therefore the color LED bar is only showing one green light. This was the first time in several years since I have been near Spokane, and so took the opportunity to take many readings with a few meters. This Cornet picture shows the best representation of how I felt about this travelling. Bleh! |
 Click to enlarge
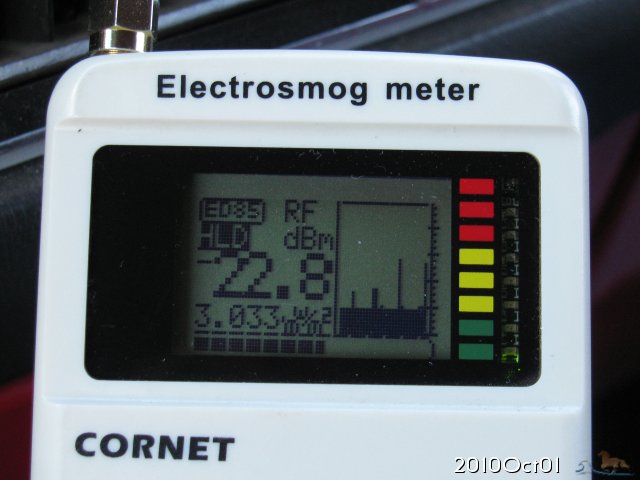 Click to enlarge
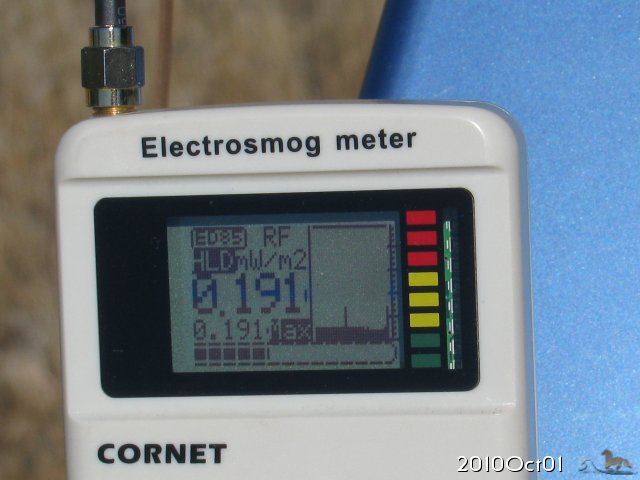 Click to enlarge
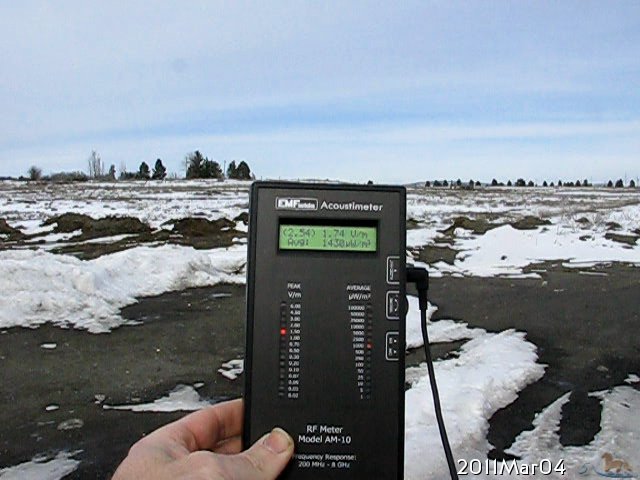 Click to enlarge
 |
 Click to enlarge, show debug codes |
 Revisiting the southwest neighbor (#3) along the county road. 4 bars on the Canary |
 Latest WiFi to the northwest, (#2) shows as 1 or 2 bars on the Canary Hotspotter |
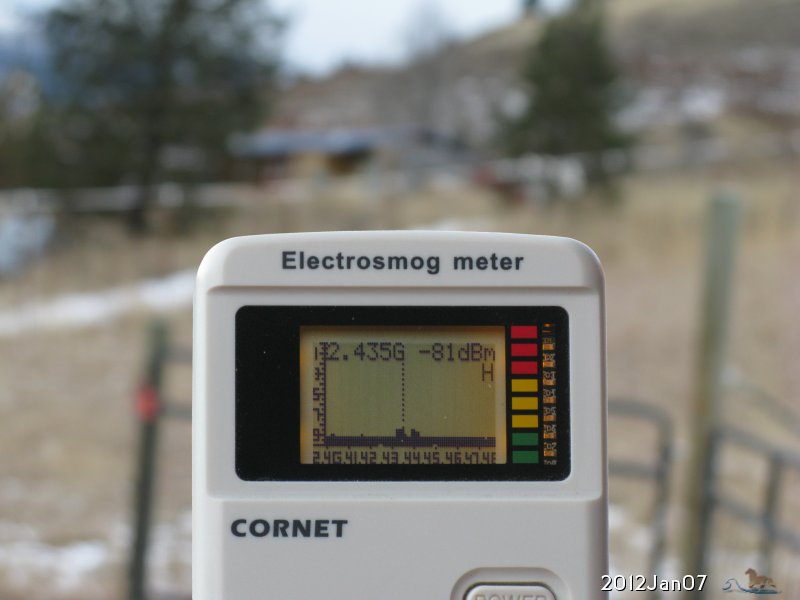
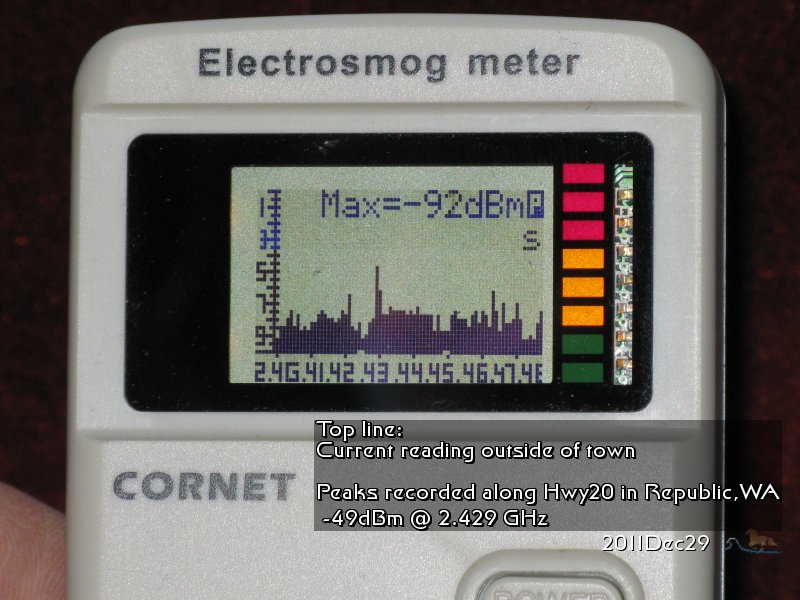 driving through Republic |
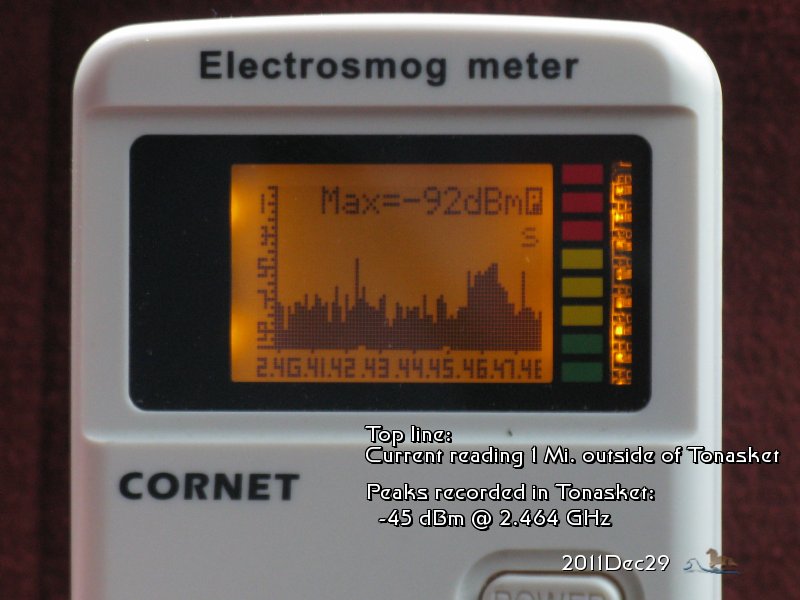 Tonasket |
 southeast neighbor #1 with a buzz like a Dect phone |
southeast neighbor #1 with Spread Spectrum WiFi beacon ON does not show up on the Canary, so is not 802.11b/g/n. |
 southeast neighbor #1 with original WiFi channel 1 back ON again shows as 3 bars on the Canary Hotspotter | |

|
|
The ICNIRP guidlenes for cell tower radiation exposure are the worst in the world. Several health effects have been reported much below these ICNIRP guidelines. The ICNIRP state that these guidelines are only for short term exposure and considers only thermal effects and does not take account non thermal effects which are more harmful and occurs much below thermal effects. According to calculations the ICNIRP guidleines implies that a human body can be safely kept in a microwave oven for 1166 secs = 19 minutes per day!! In USA, max. SAR limit for cell phones is 1.6W/Kg which is for 6 minutes. It has a safety margin of 3 to 4, so a person should not use cell phone for more than 18 to 24 minutes per day. This information is not commonly given to users. The amount of electromagnetic radiation we are exposure to, has increased 1 quintillion times over background levels. (1 followed by 18 zeros) To measure the earth's schuman resonance now, scientists must go to the open ocean to "hear" it. Have you read the fine print in your phone's manual? It says to keep away from skin at least 1 inch. Do you know the mobile industry has written their License Agreements to have NO LIABILITY for health claims. Scientists have authored 28,000 papers, of which 14,000 are peer reviewed, published in scientific journals, over several decades now, showing clear cases of harm. Yet in the media we only hear, There is no solid evidence for harm , there is no convincing evidence, or there is no valid evidence for harm... but be sure, there IS evidence. Do you see a problem yet? Educate yourself. Learn for yourself. Read or watch presentations at Part 4. |
![[Home]](images/home.gif)
|
![[Next]](images/next.gif)
|
![[Willapa Valley photos]](images/ebook-19990309-10.06-t60.jpg)
|
![[Republic photos]](images/20110501_S35SW_LambertMtn-CopperButte_SE_7215-t60.jpg)
|
![[e-Mail me]](images/mbicon.gif)
|
| ehs1.html | Updated 2022.Dec.26 |