In
part one I discussed in 2011 how to measure and map the cellular reception, using a disabled clamshell 2G cel phone.
Then when 3G started rolling out, I showed how noisy and unhealthy cellular phones are. I graphed the spectrum, and videoed the results from my meters, making several available by DVD and this web page.
I could only think of smartphones as an unhealthy addiction.
(7 years later many industry leaders are concluding this as well. See link)
As the years passed and smartphones became more sophisticated, every time a person glued to their fondle slab came near me I felt adverse reactions, starting with pain. I did not want to be around other people, so I pursued horseback riding and getting back to nature, trying to put my technical background behind me.
Several years pass, and
now with the rollout of 4G LTE, my diminishing health due to increasing microwave levels, and the loss of my horses (a double slam from this neighborhood), I turn my attention again to measuring and mapping my area. In
Part 7 I did extensive mapping with spectrum analysis for 2016, but found it difficult to pin frequencies to towers and cellular services.
Broadband meters like the Cornet ED-88T are great for painting an area with a broad brush, but don't deliver that level of detail I sought. (Where is
this frequency transmitting from? Where are the towers, and conversely, where is it safe?)
Dedicated meters are unlikely to ever do so. Why? Because of smart phones. Why build dedicated hardware that can't be upgraded when new bands become approved, when portable quad-core (and now octa-core) computers running apps can do the job easier? All the hardware necessary to make the measurements, is right there. Only the software is missing.
Look at the Canary Hotspotter. They won't make another version to cover the new 802.11ac and .11ad bands. It's not profitable. Same with Cornet ED-15SA (which is still very useful for the 2.4Ghz band). Likewise, keeping up with cellular is impossible. There are now 74 global bands created for 4G, and no sign of stopping.
My answer, because smart phones are noisy and unhealthy. Bad for the user, bad for people around you, bad for the environment. Even if you believe that EMR does not affect you, or you are blessed with resistant genes and can be exposed to several joules of energy, what will you believe when you realize the trees, the birds and bees are dying because of all this un-natural pulsed energy?
Using smart phones, actively participating in the wireless revolution is not a real solution for electro-sensitive or environmentally conscious and responsible people.
Right?
Well, maybe not.
In late 2016 I noticed that not all smart phones are noisy. People who respected my needs to turn off their devices, mostly did so. I started getting curious as to why I could not feel some of them, the ones that were still on, why some did not bother me or cause quick reactions, and so down this rabbit hole I went. Here is what my research has revealed.
Moving past broadband meters
Why is a smart phone unhealthy?
- High magnetic field
- High electric field
- High microwave or RF field
- Close contact with less than one inch from skin exceeds current safety standards (based on heating, which is now outdated thinking when non-thermal effects are acknowledged.) Seriously, have you read the legal section in your phone? How many people actually are within the guidelines?
How can these concerns be mitigated or removed? The top 3 should be considered by everybody.
- Not attempting to use the cellular functionality when there is no signal or only 1 bar. I've measured 25 V/m or 1657 mW/m² from 4 inches away, from a phone (with sim installed) trying to check in with a distant tower it briefly and barely heard. Who wrote this firmware? The symptoms from that exposure lasted 2 days.
- Turning OFF WiFi, at least when not needed, is often a separate setting from airplane mode. This is actually the highest microwave emitter, not the cellular part. (Assuming you're in an urban area, and not on a phone call.) Also some apps can turn on WiFi without disabling airplane mode, and without asking for permission, thus causing some harm at specific times.
- Turning off Bluetooth
- Removing the SIM card prevents cellular from transmitting. I'm clearly not interested in using the not-smart smartphone the way the telecoms intend.
- Putting the device into airplane mode. But this does not shut off all emissions, and does prevent the measuring of cellular because the radio modem chipset is off. So we need to turn off airplane mode when measuring.
- Removing (or not buying one with) the NFC chip and antenna. RFID chips are nasty. Both my mother, and I, and several friends with EHS, have insomnia when these chips are close by. I describe my symptoms from holding a sealed envelope from the mailbox as a painful sucking dizzy feeling. It does not take long for me to feel there is a embedded chip in this envelope delivering a new credit card.
- Removing (or not buying one with) the QI wireless charger
- Since most devices today have NFC and wireless chargers, at least keep them off. Turning them on, energizing the antenna, causes it to charge up and cause biological effects for at least a day.
- Using a mouse and keyboard via the OTG USB port, keeps the body away from the touch screen, only useful when configuring, like at home. Some of the touch-screens bother me more than others. The electrical and magnetic fields are a good reason to limit time in close proximity.
- Choosing a quality device made by good engineers
Yep, that problem again. In
Part 3 I did extensive measuring of different devices and components found indoors. Finding a quiet desktop computer is like looking for a needle in a haystack. It is not an easy task.
I already know that iPhones and some iPads have a bad reputation for being exceptionally noisy and strong. There are videos on Youtube showing measuring their emissions when not in active use by the person, just sitting on the table.
Some touchscreens are horrible, but some are not bad. The differing LCD technologies also create different emissions.
The Samsung screen is AMOLED. This looks to be better than backlit LCD, and OLED looks to be the best and lowest emission choice available.
A metal or aluminum case will reduce emissions from getting out, although Samsung seems capable of engineering a quiet board with only a plastic case. (Looking at the Galaxy S5)
A search for portable computers with
metal case, lots of bands, no NFC, and no QI, narrows down the list of possible choices.
(I am not looking for a celphone or smartphone, as these imply talking and transmitting.) I'm looking for a mobile computer with 4 to 8 low-energy cores that does not hurt me, with the right radio chip to act as a measurement tool.
| background level |
M 0.0 mG
E 0 V/m
RF 0.000 mW/m² |
RF
<0.02 V/m |
RF
2 at sensitivity 10 |
RF 0.0083 V/m
0.1827 µW/m²
< -65 dBm
<7.1 mV ADC |
M
0.05 mG |
E
8 V/m
baseline level |
| device being measured |
TF2 peak
(not moving)
at zero distance,
and radius of bubble |
Acoustimeter
at zero distance, and
distance for audio to disappear |
Zap Checker 180
at zero distance, and
distance to get 5 at 10 |
Cornet ED85-EX
at zero distance, and
distance to background level |
GaussMeter
at zero distance,
and distance to
get <= 0.2mG |
Cornet ED88T
E-Field at zero distance,
and distance to get down to background |
Samsung Galaxy S5 G900A
front side screen |
M 1.1 mg
2 inches |
E 15 V/m
0.25 inch |
RF 4.039 mW/m²
1.234 V/m
2 inches |
|
0.02 V/m
0.5 in.
(1 cm) |
30 at sensitivity 10
1 in.
(2.5 cm) |
0.0083 V/m
-65 dBm
7.2 mV ADC
0 in.(0 cm) |
2.5 mG
2 in.
(5 cm) |
26 V/m
2 in.
(5 cm) |
Samsung Galaxy S5 G900A
back side |
M 0.7 mg
2 inches |
E 4 V/m
0.25 inch |
RF 0.046 mW/m²
0.132 V/m
1 inch |
|
0.02 V/m
3.5 in.
(9 cm) |
35 at sensitivity 10
1 in.
(2.5 cm) |
0.0218 V/m
0.0012 mW/m²
-56 dBm
7.9 mV ADC
0.25 in.(0.6 cm) |
6 mG
3 in.
(8 cm) |
17 V/m
0.5 in.
(1 cm) |
LG Nexus 5 D820
front side |
|
0.02 V/m
3.5 in.
(9 cm) |
90 at sensitivity 10
2.5 in.
(6 cm) |
-65 dBm
0.1827 µW/m²
7.5 mV ADC
|
5 mG
4 in.
(10 cm) |
96 V/m
1 in.
(2.5 cm) |
LG Nexus 5 D820
back side |
|
0.02 V/m
2 in.
(5 cm) |
30 at sensitivity 10
1.25 in.
(3 cm) |
-65 dBm
0.1827 µW/m²
7.5 mV ADC
|
4 mG
2 in.
(5 cm) |
380 V/m
2 in.
(5 cm)
source: NFC |
LG G5 RS988
front side |
|
0.04 V/m
8 in.(20 cm) |
| or | | | 23 in.(58 cm) when touching screen |
|
70 at sensitivity 7
10 at 6
3.2 in.
(8 cm) |
-65 dBm
0.1827 µW/m²
7.5 mV ADC
|
2.5 - 6 mG
4 in.
(10 cm) |
86 V/m
2 in.
(5 cm) |
LG G5 RS988
back side |
|
0.02 V/m
3 in.
(7 cm) |
15 at sensitivity 10
0.25 in.
(1 cm) |
-65 dBm
0.1827 µW/m²
7.1 mV ADC
|
9 mG
3 in.
(8 cm) |
14 V/m
0.2 in.
(1 cm) |
HTC One A9
front side |
M 3.2 mg
1.5 inches |
E 10 V/m
0.25 inch |
RF 2.674 mW/m²
1.004 V/m
2 inches |
|
0.02 V/m
3 in.(8 cm) |
20 at sensitivity 10
2.5 in.
(6 cm) |
-65 dBm
0.1827 µW/m²
7.2 mV ADC
|
27 mG
3.5 in.
(9 cm) |
12 V/m
0.25 in.
(1 cm) |
HTC One A9
back side |
M 3.2 mg
4 inches |
E 11 V/m
0.25 inch |
RF 0.041 mW/m²
0.124 V/m
0.25 inch |
|
0.04 V/m
3 in.
(8 cm) |
20 at sensitivity 10
4 in.
(10 cm) |
-55 dBm
1.832 µW/m²
11.8 mV ADC
|
58 mG
2.75 in.
(7 cm) |
35 V/m
1 in.
(3 cm) |
Samsung G930A
front side |
|
0.02 V/m
0.7 in.(2 cm) |
26 at sensitivity 10
0.6 in.
(2 cm) |
-65 dBm
0.1827 µW/m²
7.2 mV ADC
|
2 mG
0.5 in.
(1 cm) |
20 V/m
0.3 in.
(1 cm) |
Samsung G930A
back side |
|
0.03 V/m
0.2 in.
(1 cm) |
6 at sensitivity 10
0 in.
(0 cm) |
-65 dBm
0.182 µW/m²
7.1 mV ADC
|
2 mG
0.5 in.
(1 cm) |
24 V/m
0.2 in.
(1 cm) |
| Amazon Kindle Fire 10.1 |
|
0.02 V/m
6 in.
(15 cm) |
|
-65 dBm
0.182 µW/m²
7.2 mV ADC
|
0.6 mG
0.5 in.
(1 cm) |
323 V/m
1 in.
(3 cm) |
Google Pixel
front side |
M 4.2 mg
2 inches |
E 13 V/m
0.25 inch |
RF 0.713 mW/m²
0.518 V/m
1 inch |
|
0.02 V/m
1 in.(2 cm) |
80 at sensitivity 10
2 in.
(5 cm) |
-65 dBm
0.182 µW/m²
7.2 mV ADC
|
4.5 mG
3 in.
(8 cm) |
14 V/m
1.5 in.
(4 cm) |
Google Pixel
back side |
M 1.3 mg
2 inches |
E 11 V/m
0.25 inch |
RF 0.028 mW/m²
0.103 V/m
0.25 inch |
|
0.02 V/m
1 in.
(2 cm) |
50 at sensitivity 10
1 in.
(2 cm) |
-65 dBm
0.182 µW/m²
7.2 mV ADC
|
6 mG
3.5 in.
(9 cm) |
11 V/m
2 in.
(5 cm) |
LG V30 H932U
front side |
M 5.9 mg
5 inches |
E 20 V/m
2 inches |
RF 2.761 mW/m²
1.020 V/m
2.5 inches |
|
0.02 V/m
2 in.(5 cm) |
14 at sensitivity 10
2 in.
(2 cm) |
7.1 mV ADC
below threshold |
18.5 mG
2.5 in.
(6 cm) |
54 V/m
3 in.
(8 cm) |
LG V30+ US998U
front side |
M 9 mg
2 inches |
E 61 V/m
1 inches |
RF 1.722 mW/m²
0.806 V/m
1.5 inches |
|
0.02 V/m
2 in.(5 cm) |
10 at sensitivity 10
0.5 in.
(1 cm) |
7.1 mV ADC
below threshold |
5.9 mG
3 in.
(8 cm) |
29 V/m
8 in.
(20 cm) |
OnePlus 6T A6013
front side |
M 0.7 mg
1 inches |
E 2 V/m
0.5 inches |
RF 0.525 mW/m²
0.445 V/m
1.7 inches |
|
0.02 V/m
0.5 in.(1 cm) |
60 at sensitivity 8
1.0 in.
(2 cm) |
7.1 mV ADC
below threshold |
8.6 mG
1.5 in.
(4 cm) |
14 V/m
1 in.
(2 cm) |
When Charging
Lines below have: device is on, airplane mode on, Wifi off, Location off, NFC off, Bluetooth off, screen off (locked or sleeping) |
Samsung G900A
during charging |
M 1.7 mg
2 inches |
E >1000 V/m
14 inches |
RF 0.327 mW/m²
0.351 V/m
5 inches |
|
0.02 V/m
6 in.
(15 cm) |
60 at sensitivity 5
17 in.
(43 cm) |
7.9 mV ADC |
6 mG
1 in.
(3 cm) |
488 V/m
11 in.
(28 cm) |
Nexus 5
during charging |
|
0.04 V/m
2 in.
(5 cm) |
50 at sensitivity 10
8 in.
(20 cm) |
7.1 mV ADC |
23 mG
2 in.
(5 cm) |
930 V/m
8 in.
(20 cm) |
HTC One A9
during charging |
M 2.8 mg
2 inches |
E >1000 V/m
29 inches |
RF 0.158 mW/m²
0.244 V/m
4 inches |
|
0.02 V/m
3 in.(8 cm) |
30 at sensitivity 10
3 in.
(8 cm) |
|
4 mG
1 in.
(3 cm) |
767 V/m
12 in.
(26 cm) |
Samsung G930A
during charging |
|
0.03 V/m
6 in.
(15 cm) |
20 at sensitivity 5
or 100 at 6
9 in.
(23 cm) |
7.5 mV ADC |
3 mG
1.3 in.
(3 cm) |
66 V/m
3 in.
(8 cm) |
Google Pixel
during charging |
M 1.3 mg
2.5 inches |
E >1000 V/m
26 inches |
RF 1.906 mW/m²
0.848 V/m
3 inches |
|
0.03 V/m
3 in.(8 cm) |
95 at sensitivity 6
12 in.
(30 cm) |
7.7 mV ADC
|
14 mG
4 in.
(10 cm) |
696 V/m
12 in.
(30 cm) |
LG V30 H932U
during charging |
M 5.8 mg
2 inches |
E 990 V/m
28 inches |
RF 0.203 mW/m²
0.277 V/m
4 inches |
|
0.03 V/m
0.5 in.(1 cm) |
85 at sensitivity 10
11 in.
(28 cm) |
7.1 mV ADC
|
14.1 mG
8 in.
(20 cm) |
986 V/m
18 in.
(46 cm) |
OnePlus 6T A6013
during charging |
M 0.2 mg
0.25 inches |
E 448 V/m
6 inches |
RF 0.644 mW/m²
0.492 V/m
5 inches |
|
0.05 V/m
2 in.(5 cm) |
70 at sensitivity 6
6 in.
(15 cm) |
7.1 mV ADC
|
9.1 mG
2.5 in.
(6 cm) |
243 V/m
9 in.
(23 cm) |
| device being measured |
M
E
RF |
RF |
RF |
RF |
M |
E |
The TF2 is the only one capable of detecting
the pulsating charging and functioning of the touch screen. This shows a good reason to use a stylus pen, instead of your fingers.
On the positive side, the Samsung Galaxy S5 G900A is quieter than my Canon camera. Quieter than my desktop monitor. That's stunning.
So it IS possible to do the impossible. Some of it makes sense, the mobile computing chips are designed for
low power consumption, thus more likely to be low-emissions or low EMI. My attitude toward portable computers will need adjusting. Even though 99.99% of them are used for unacceptable purposes. Quite the dilemma, from a philosophical point of view.
I don't actively seek out cell phones to measure, so I don't have an extensive presentation for this table. But I have measured an E-field in the several hundreds V/m from a visitor's touch-LCD screen, on battery power. I don't know which brand. Someday I hope to add more solid data to this chart. In fact, 3 models have already been added to the first, provoking a conclusion that maybe the Samsung G900A was like a diamond in the rough, since no other device tested so far is as quiet and tolerable. Maybe my earlier attitude is not so wrong after all...
Here are the operational problems I reveal.
- Samsung, AT&T, and Google, have locked down the software in their respective models, although it is hit and miss which models have the necessary service menus still present. Having a model with the service menus is a key to successful mapping, so that one band can be searched at a time.
- Only 4 of the 12 North American bands are available in the G900A, so to measure the newer bands requires a newer model.
- OTG Ethernet is available in tablets, but not available on the smartphone, either disabled or not included in the Android software, so I can't plug in a wired ethernet cable to connect online. Without this alteration, the only way to install software is by an unacceptable and difficult process (for me) using WiFi. Finding as many apps as possible that do not require an internet connection, becomes a top priority.
- Many phones are not currently rootable, but many are. Gaining root allows the above road-blocks to be removed, but maybe not always. I still am limited by available software, and I'm no longer able to write my own code. This is only getting worse as the industry clamps down for control. Even worse, the RS988 is encrypted, and this looks like a contributing factor in the increased noise level, as the processor must work harder to continually encrypt and decrypt data. As of this writing, both the Samsung and HTC shown above are now rootable, allowing me to keep working on this mapping project safely. The newer LG models don't have the roadblocks, and work very well.
- 2018 brings a new roadblock. New security features that completely lock down the usability of Samsung's S7 as a mobile computer. They clearly don't want geeks using their devices without doing it Their way, and Only Their Way. Samsung is no longer on my "good company" list.
- 2018 also brings benefits, some Android Nougat and Oreo ROMs (those with kernel-4) now include Internet over Ethernet LAN support, making it so much easier to connect without any wireless. I have had the most success with Anker brand.
So overall, I can not use the hardware to it's full potential. Therefore the reason my search did not stop with device #1.
By "mapping safely" I mean: No transmitting and logging, for weeks or months without needing to connect online.
On to getting results, I recommend the following software:
- ADB (Android Debug Bridge) provides the best way to upload and download apps and logs by USB cable
- Network Cell Info was my top pick and 5 star favorite for writing log files, but recent versions have added DRM and also stopped working with the HTC A9 as the developer said "The sim is absent, hence is no log." This discrimination is not necessary, as the rest of the app displays current cells ID and signal strength just fine...
- LTE Discovery
is was the only app to show the band number in 4G (relevant to Android 6 and lower). Not working as well with newer versions.
- G-MoN is my next attempt to find a replacement for Network Cell Info. Finally an app that records all the neighbor cells. Warning, due care must be taken to disable the Wi-Fi scanning.
- G-Net Track Pro is my latest attempt to find a replacement for Network Cell Info, it records all the neighbor cells, finally!, plus band numbers, plus after reporting to the developer problems when the SIM is absent, it now works well. Very well.
- AZ Screen Recorder to record the results on screen when logging is not enough. No longer necessary as the above 2 apps take care of logging neighbor cells with GPS coordinates.
- RF Frequency calculator has complete list of bands and their frequency ranges.
- Package Disabler Pro to get rid of the (Samsung only) bloatware that eats battery life and makes extra noise. Other models require manual disabling of unnecessary apps, rooting often required.
- GPS Test shows the new GPS bands, with coverage better than my old but quiet Garmin, shows satellite signal strength too. The difference in signal strength between outside and inside is visually clear. Measuring the effectiveness of shielding is also a benefit.
- There are other useful helper apps, like SD_Maid and Physics, but these are the main ones pertinant to this discussion.
(On the G900A) With the bloatware removed, battery usage is practically zero when the screen is off. That is a big deal. Many people complain about battery drain in stock (unaltered-from-the-vendor) models.
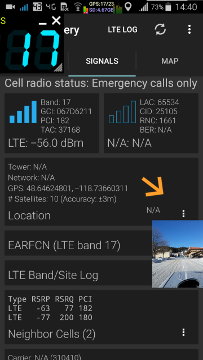
Using the developer codes, for some models, I can select which band to listen on, one at a time, so after several trips into town, after 2 months I got a complete picture of how many cells there really are. 30 confirmed unique IDs. Plus more since I know there should be activity on at least one band I can't measure without newer hardware.
At home I can measure 2 cells on 2G, 2 cells on 3G band 5, and 1 cell on 4G band 17. Despite being 7 miles from the nearest tower. Not far enough...
Then on
2017.Jan.05 the 2G services were sunsetted. Turned off. About 1/3 of the background went quiet. I noticed. It is better, but not a big part of the pie anymore. All the clam shell GSM emergency phones are now junk and useless. Instantly obsolete, by design.
Then over the next week, new 4G cells were added to make up for the loss. Oh, and now another 3G cell... Since 2G was an always on whine, I'll tenatively say this should be better, and since I can now prove the 2 new towers built in late 2015 are still not active (at least not in the primary cellular bands), the situation here is not all doom and gloom.
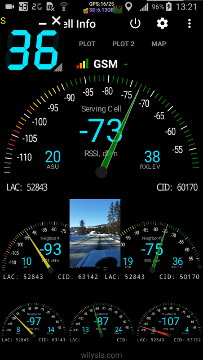
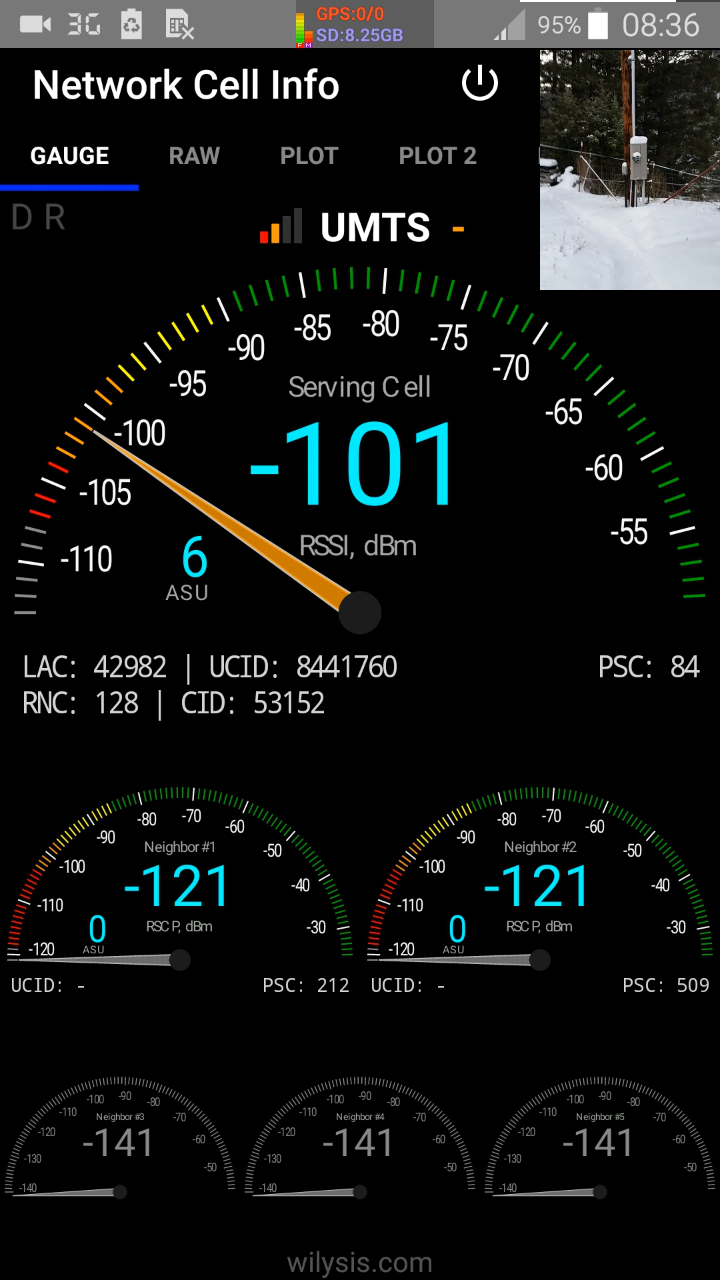
Here's what my setup looks like in action. There was a LOT more exposure from 2G cells than 3G or 4G.

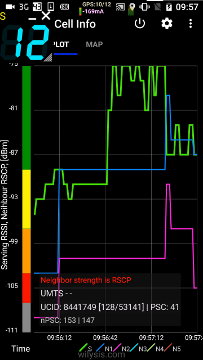
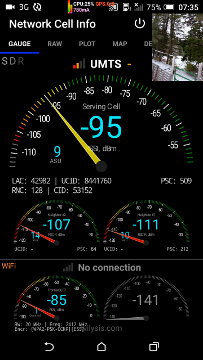
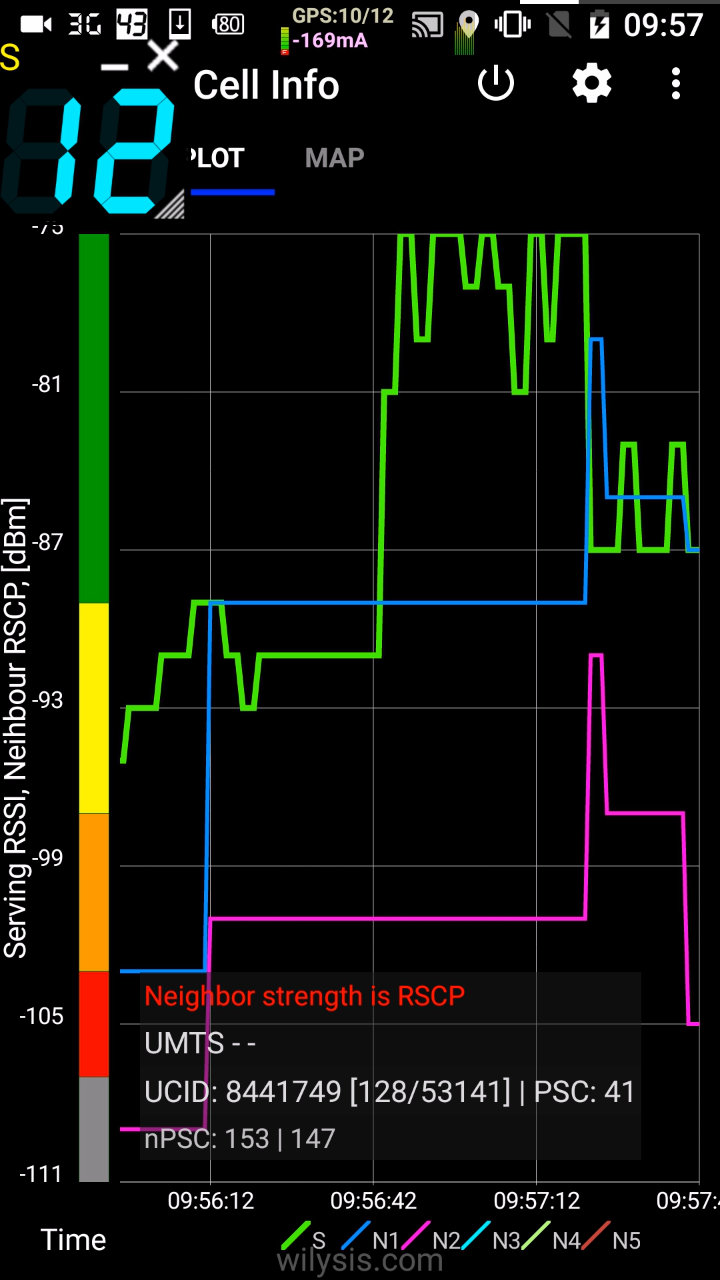
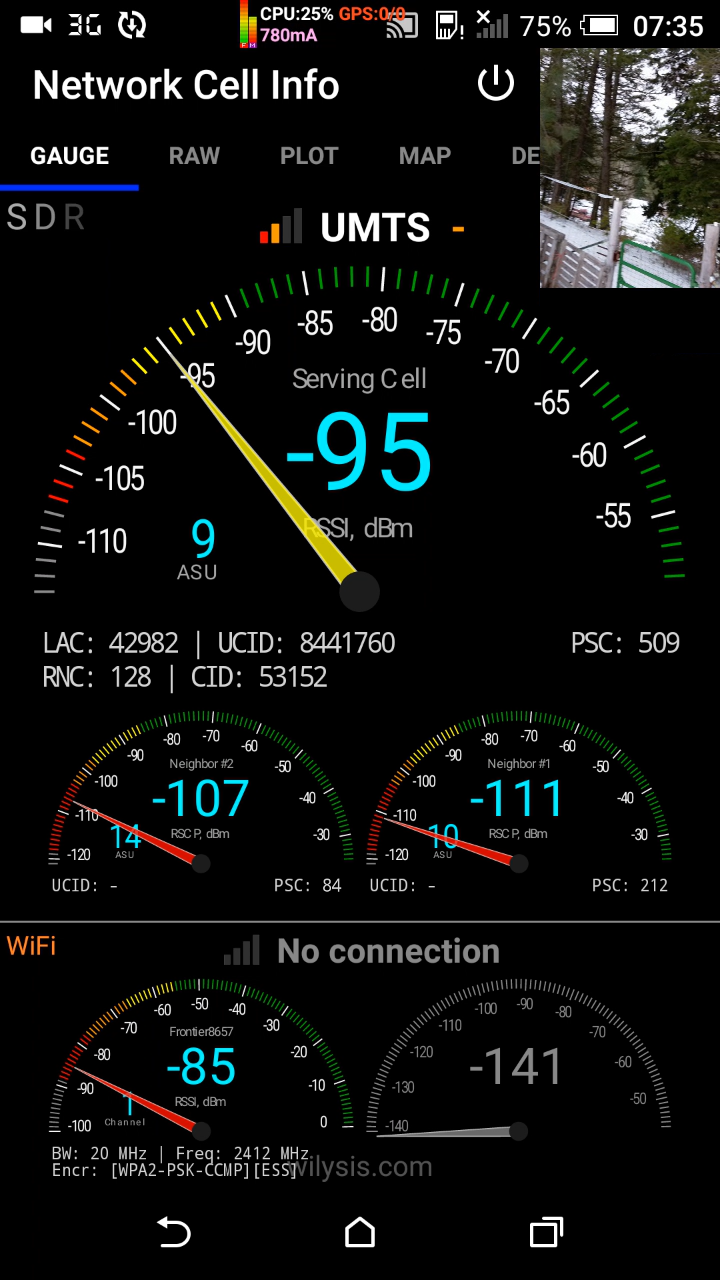
Too bad Samsung devices (for which they have a reputation) do not report neighbor cells signal strength correctly (always for 3G, seen above in screenshot # 3). This is the most useful data to determine by echo-location and shadow-mapping which towers are responsible for which cells. When it says -121 all I know for sure is it is below (weaker) the primary cell. Moving on to testing a non-Samsung device (# 4) shows this problem can definitely be solved, although when the neighbor lines go flat, it is clear the device is not tracking fully. The level shown sticks to the last known level, until it reaches a timeout 20 or 30 seconds after last contact.
The Nexus gives a wierd sucking feeling that I recognize as RFID and NFC being strong. Putting my technician skills to use, I opened it and removed the offending parts. (The NFC in the Samsung was easy to remove as it was on the removable battery, I recommend Anker for the replacement, as it has no antenna, and does hold the rated capacity of 2800 mAh). It (back to the Nexus) does measure 3G neighbors correctly though, and does have the best reception of 4G band 4. There is hope I'll eventually find the right one. My research says the D820 might be rootable,
(edit that, it is.) so that's a big positive.
The RS988 covers 7 of the 10 North America 4G bands. It does not give the nasty NFC/RFID feeling, but is not as quiet as the Samsung, since the screen is old-technology LCD, and wow why is this screen so noisy? The metal case can be a huge positive, but this case has a flaw in the connection to the antennas, and so is a major flaw out of the factory in design. This one gets the reject stamp and goes back to where I bought it.
Both the timeout and quality of tracking in gaps varies from manufacturer to manufacturer.
2017.Mar
I started this mapping because of the increasing level of pain and mental disfunctions. I expected to find the only problem source was from the new towers. I am both shocked and disappointed to see the 3G signal ID 509 in the above #3 screenshot taken Jan.08, is actually coming from nearby. Neighbor #1 knows I am sensitive to wireless, so either he does not care anymore, or he is now able to suspend belief against me. Since his behavior has been hostle toward me, it's easy to conclude it is intentional. He has threatened me a few times, and his language toward me is foul.
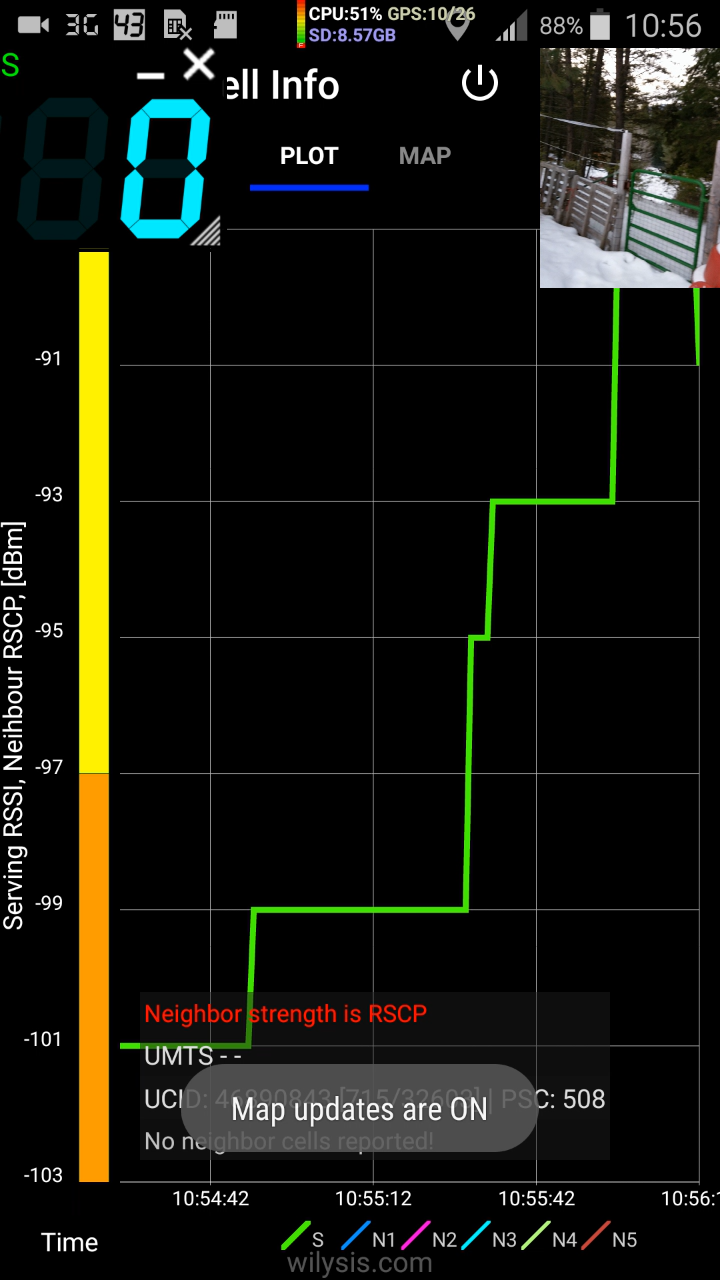
The signal strength rises as I walk toward the SE corner of my property:

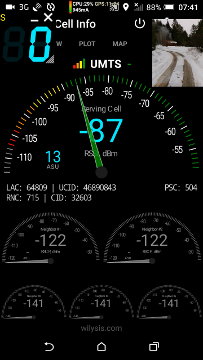
The in-home cellular hot spot has an unusual LAC-CID and seems to take over the Qualcomm firmware, making itself the dominant signal and always making the other signals (from Franson Peak) disappear. The PSC also changes daily, but stays within a range from 504 to 509.
If anybody thought sunsetting 2G would improve the situation, they were wrong. Health wise that is. From a corporate financial viewpoint, this is great for the economy... Everybody is motivated to buy new toys, and certainly has increased my purchasing of pharmeceuticals to keep functioning.
Now I am seeing these in-home cellular stingray hotspots popping up everywhere with poor coverage. Currently averaging 1 or 2 per mile. Unbelievable.
On the negative side, this will only accelerate the health crisis that is coming..
update added 2019.Nov In the last 2 years since the hotspots have popped up, I have seen the number of insects and birds decline, here. Not just in the city, but here, rural too. When I go to a quiet zone, I see more insects and birds and spider webs. But at home, each year has less life. I see eggs not hatching in the bird nests. Remember microwaves are linked with infertility...
Back to 2017:
The only services online providing coverage maps, may work very well for cities with thousands of volunteer contributors, but out here they are very inadequate:
Open Signal mapping,
Republic, WA
Mozilla Location Service shows mapping my area, but doesn't show signal strength. Another Samsung flaw. Seems they only show measurements from paying customers with sims and contracts. Well, that excludes me. If I want coverage maps, I have to do it myself!
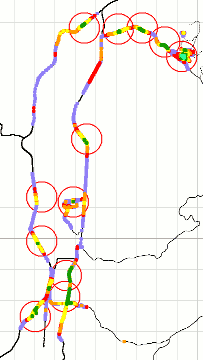
2017.Jun
The maps I've generated over 6 months of measuring 66,560 data points, are now posted here, covering: CDMA (2.5G), UMTS (3G), LTE (4G) band 4, band 13, and band 17. They make more sense when the terrain of valleys and hills are added. Here are the results for north Ferry county, from Franson Peak near Curlew to Union Ridge and Knob Hill overlooking Republic:
2019.Oct-2020.Oct
Plus 3 years, the cellular database now has 1,315,649 data points, plus the internet service over WiFi database now has 97,044 data points. I've rebuilt the tools necessary to handle this much larger size, wrote my own programs to do the mapping, and yes it took 2 years. The epidemic of
digital dementia is affecting me too. Updated maps are animated showing each cell and it's sector of the circle, one band (frequency range) per map:
All measurements show
PEAK values across several devices, not average, and not likely what your mobile will get, since results do naturally vary from day to day.
Click to enlarge:


The new animated maps show how the location of a tower can be pinpointed by where the 3 sectors converge in the center. One antenna covers 120 degrees of the circle, thus 3 antennas per tower per carrier service.
|
Band | Downlink
Frequency (MHz) | Carrier | year
added | year
sunsetted |
|
2.5G / CDMA |
|
0 | 879-887 | Verizon | c.1999 | 2022 |
|
3G / UMTS / WCDMA |
|
2 | 1952.2 | T-Mobile | 2019?, not local |
|
4 | 2152.5 | T-Mobile | c.2003 |
|
5 | 871.6
876.2 | AT&T | c.2003 | 2022.Jun |
|
4G / LTE |
|
2 | 1935.0 | Inland Cellular | 2019.Sep
2020.Jan around Curlew Lake |
| 1957.5 | T-Mobile | 2022.Aug |
| 1982.5 | AT&T | 2021.Aug |
|
4 | 2115.0 | AT&T | 2021.Aug |
| 2125.0 | Verizon | |
| 2145.0 | T-Mobile | |
|
5 | 871.5 | AT&T | not local |
|
12 | 731.5 | T-Mobile | |
|
13 | 751.0 | Verizon | |
|
17 | 739.0 | AT&T | 2009 |
|
26 | 884.9 | Sprint | not local c.2019 |
|
30 | 2355.0 | AT&T | not local c.2022 |
|
41 | 2608.0
2623.5 | T-Mobile | not local c.2022 |
|
66 | 2165.0 | AT&T | 2021.Aug |
|
71 | 629.5 | T-Mobile | 2019.May | 2024.Feb |
|
14 | ___._ | First Net | c.2019 |
|
5G |
|
17 | ___._ | AT&T | 2022.Nov new antennas |
71 | ___._ | T-Mobile | Map says: commercially available
2020
Replaced 4G-LTE 2024.Feb | |
77 | 4200 | AT&T | 2022.Mar |
|
79 | 4400 | AT&T | 2022.Mar |
[Enlarge] Coverage maps by carrier as of 2021 before the 5G rollout and 3G shutdown.
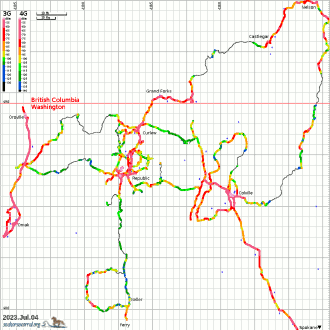
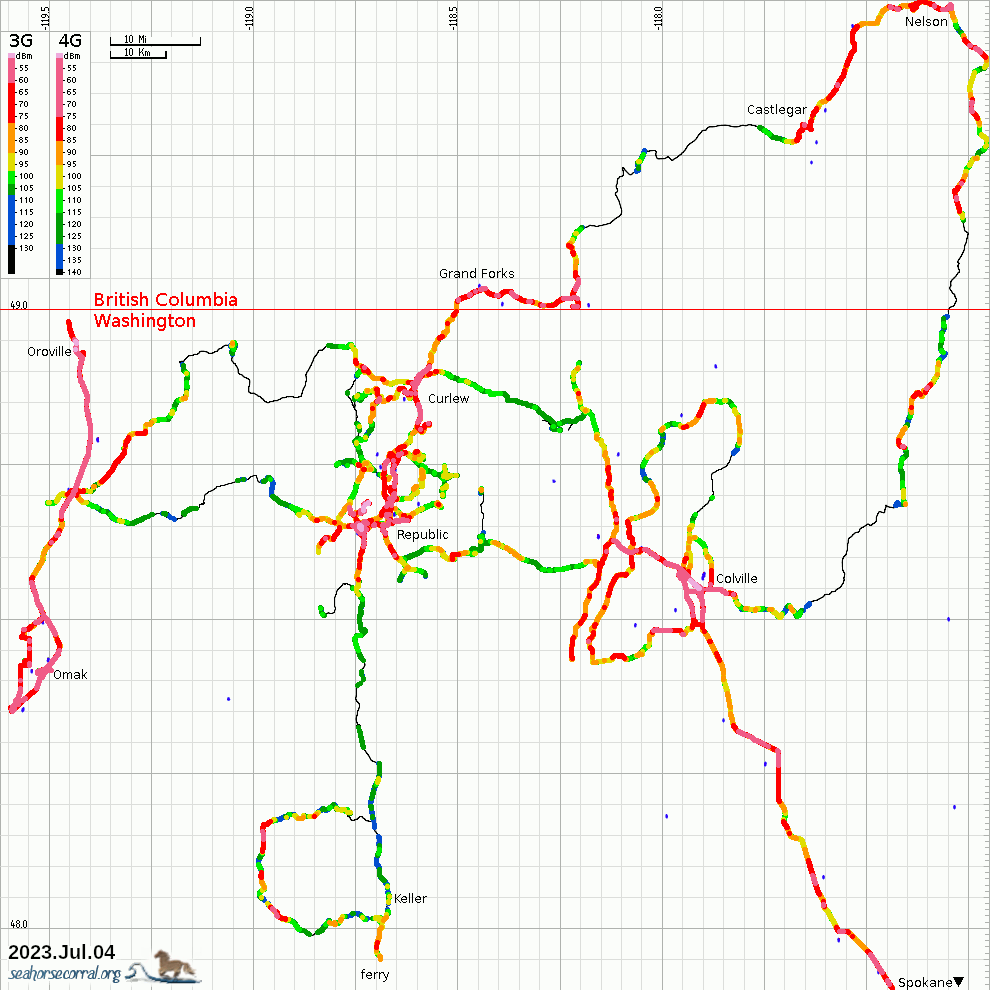
Zoomed out to NE Washington State and SE British Columbia
Now the 6 years of traveling and recording measurements can be seen, and why the database has grown so large.
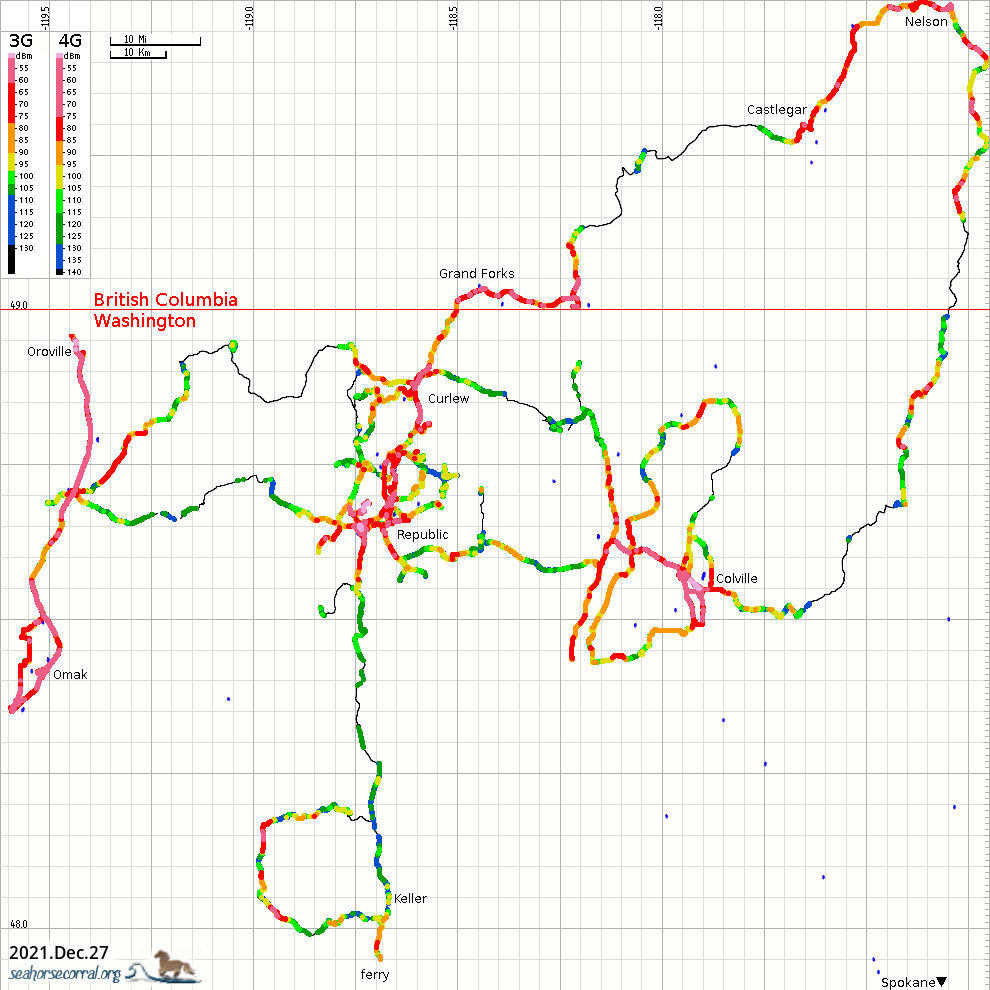
Compare to
2021 before carrier upgrades in 2022. Only the Curlew-Spokane highways were visited in 2022.
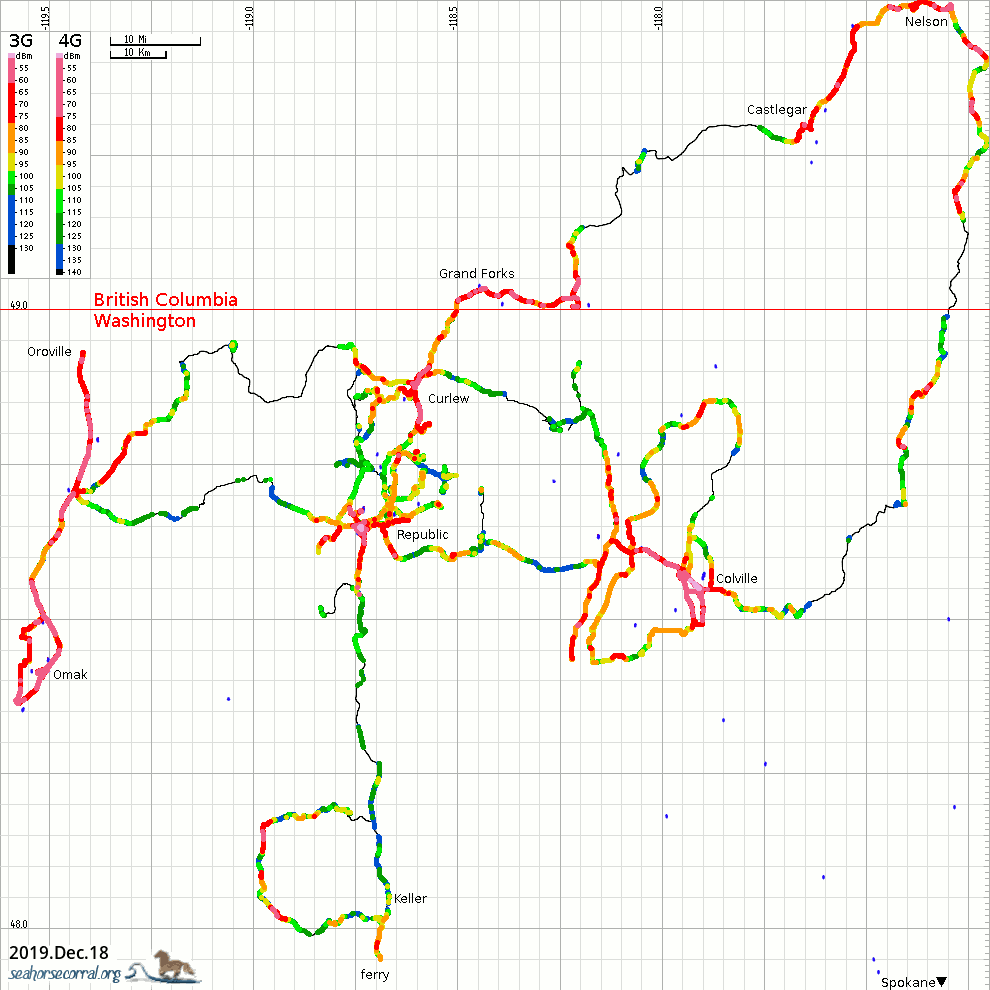
Compare to
2019 before band 2 was added in 2020.January.
Discovering the Cell IDs on distant towers also brings closure to the occasional recordings not seen locally, usually on the mountain passes.
In one case a new CID recorded on the Kettle Crest (high elevation), turned out to be from a tower 60 miles away. And another one 53 miles away.
Just last month I caught another one halfway up the hill here above home, with one bar on band 71 for under a minute, that because of the mapping effort, I recognize to be from 47 miles away. Not a useable signal, but it is an example of how much EMR there is in the air.
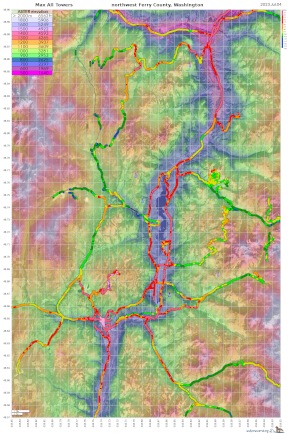
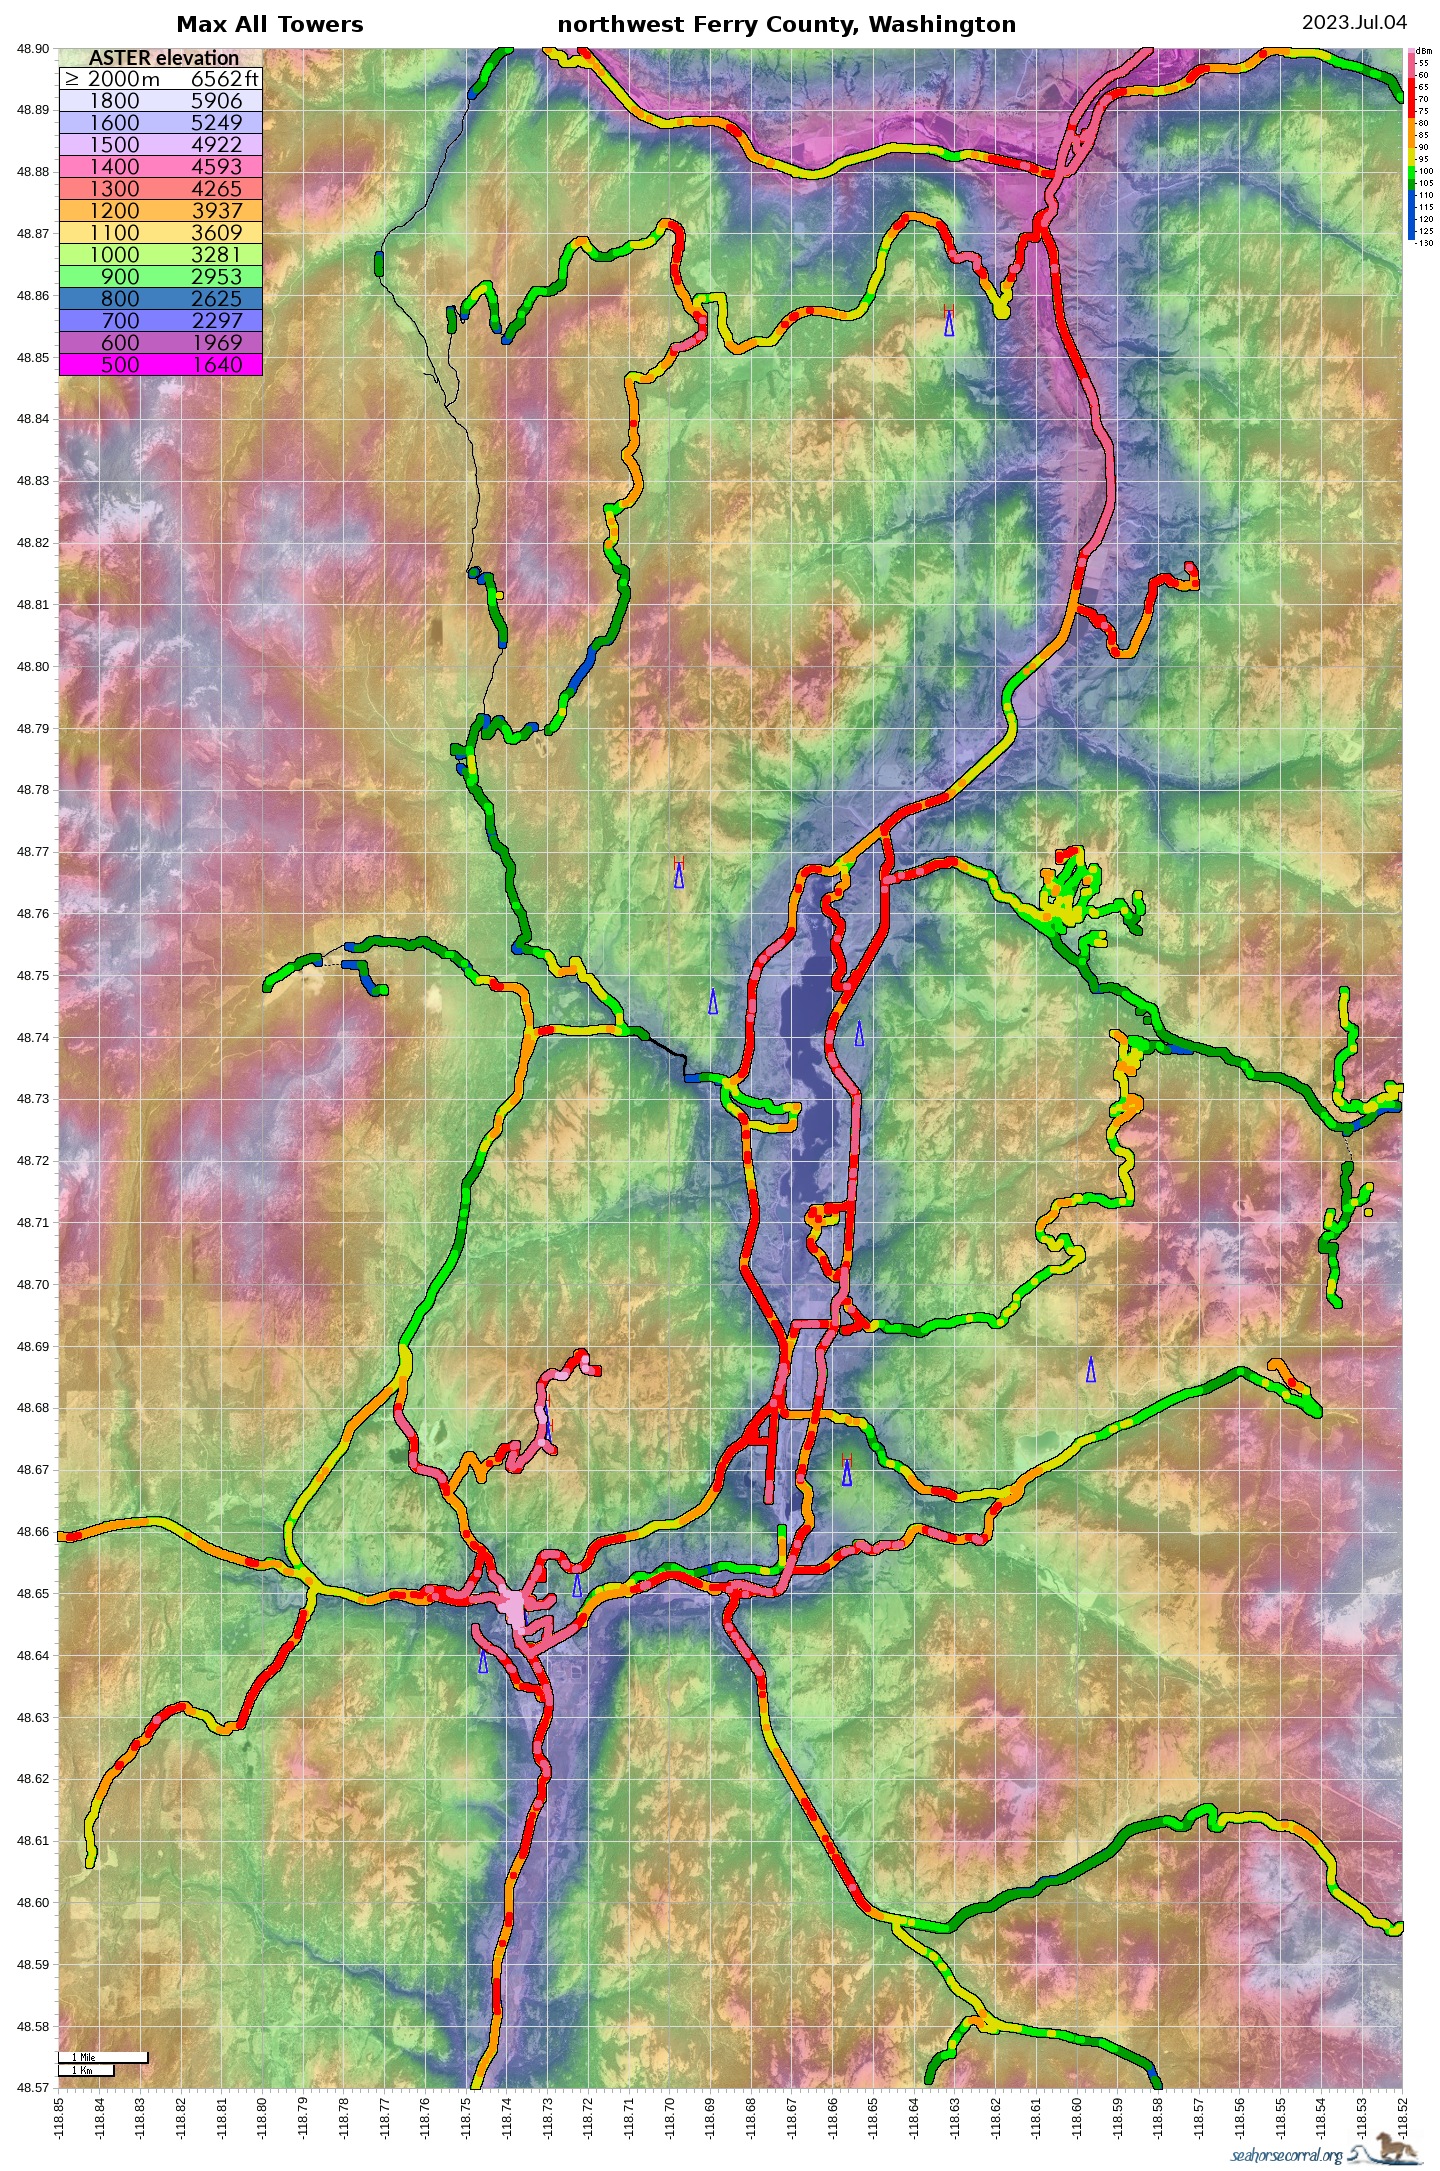
[Enlarge] All cellular in northwest Ferry County, with topographic by ASTER, partial opacity with aerial photography.
[JPG] Here's an alternative without the aster layer.
I added the topographic layer to clarify why some areas get coverage and others don't. It's all about:
1. the terrain, casting shadows.
2. the band frequency, higher frequencies are only strong in line of sight.
3. how much power (watts) the carrier powers the tower with. and
4. how good the reflections bounce into shadowed valleys, bouncing off the rocks.
The 2023 map compared to earlier maps shows the changes after major antenna upgrades, but is not a complete comparison without revisiting all distant areas.
I still hate cell phones. They are evil. Transmitting, they ruin health and lives, and are bad for the environment. But if used correctly as a mobile portable computer, like a small laptop, it can be a useful tool. There is still a clear line of demarkation. However it still does not feel right, as if I'm somehow showing approval of technology again, a step backwards. When there is a need to keep some distance from the device, I see a new unanticipated use for those silly selfie sticks.
2021.Dec
I have updated all maps to be of a consistent color scale as shown in the legend. Also the new bands added by AT&T is causing havoc around the valley, as cellular service has dropped into a hot topic of complaints. Before this year, AT&T only offered band 17 (a subset of band 12, but wholy owned by one carrier) to this valley. It is a very strong signal, as my maps show. Then in August, they added band 2 and 66 (band 4 is a subset of 66). Meant for high speed data in the city, it is a decision made by somebody who has only the Oklahoma version of our map. High speed, high frequency only works in flat places! Now any celphone that hears band 2 or 4, switches over to it automatically, even if the reception is worse than band 17. It is. Much worse.
2022.Mar
Now scanning spectrum up to 7 GHz, I can see 5G is here. Especially evident around the aircraft radar band from 4.2 to 4.4 GHz, and even intruding into it. I intend to add those graphs to the spectrum analysis page 7.
I hope you find something useful from my tips and experience that can help you too. None of the above screenshots required any special skills or rooted software. The basic apps are free to download and try out.
"How am I doing?" My health updates are consolidated at part 2
|
Reduce your exposure.
Safety Tips:
Turn OFF WiFi. It transmits beacons 10 times per second. This is a high amount of exposure. If you must use it, then turn it back off when done.
Turn ON Airplane mode. It transmits every time you move into range of a new cellular tower, or out of range of the previous one. Several services also check for new mail or messages every 30 seconds on average.
Cell phones were created for emergency purposes only, and the inventors never saw this coming, glued to the thing 24 hours a day exceeds the safety standards, because TIME is part of the equation as much as POWER.
Turn OFF NFC and RFID. While this antenna array is low power, it still should be off when not in use. RFID chips are known to cause insomnia, assuming the other constant transmitting doesn't already do that to you.
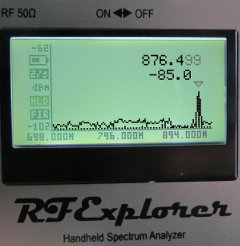
When transmitting those cell phones look like this: (for comparison purposes)
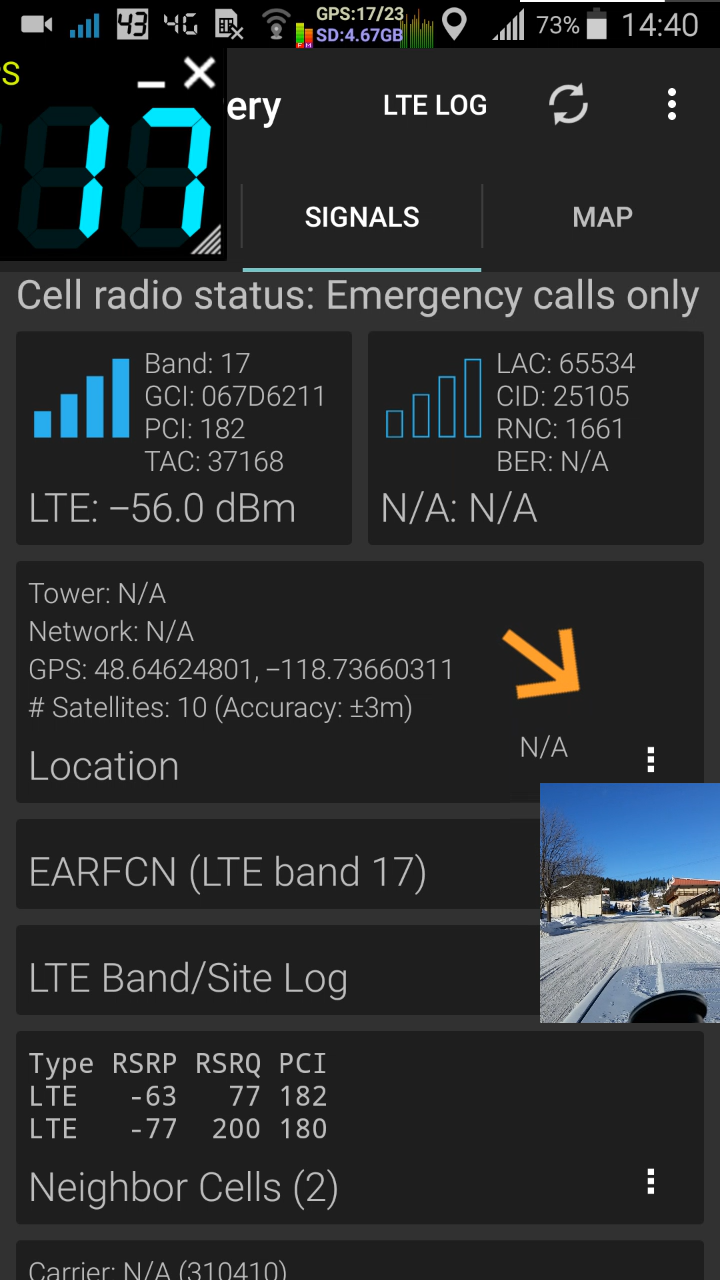


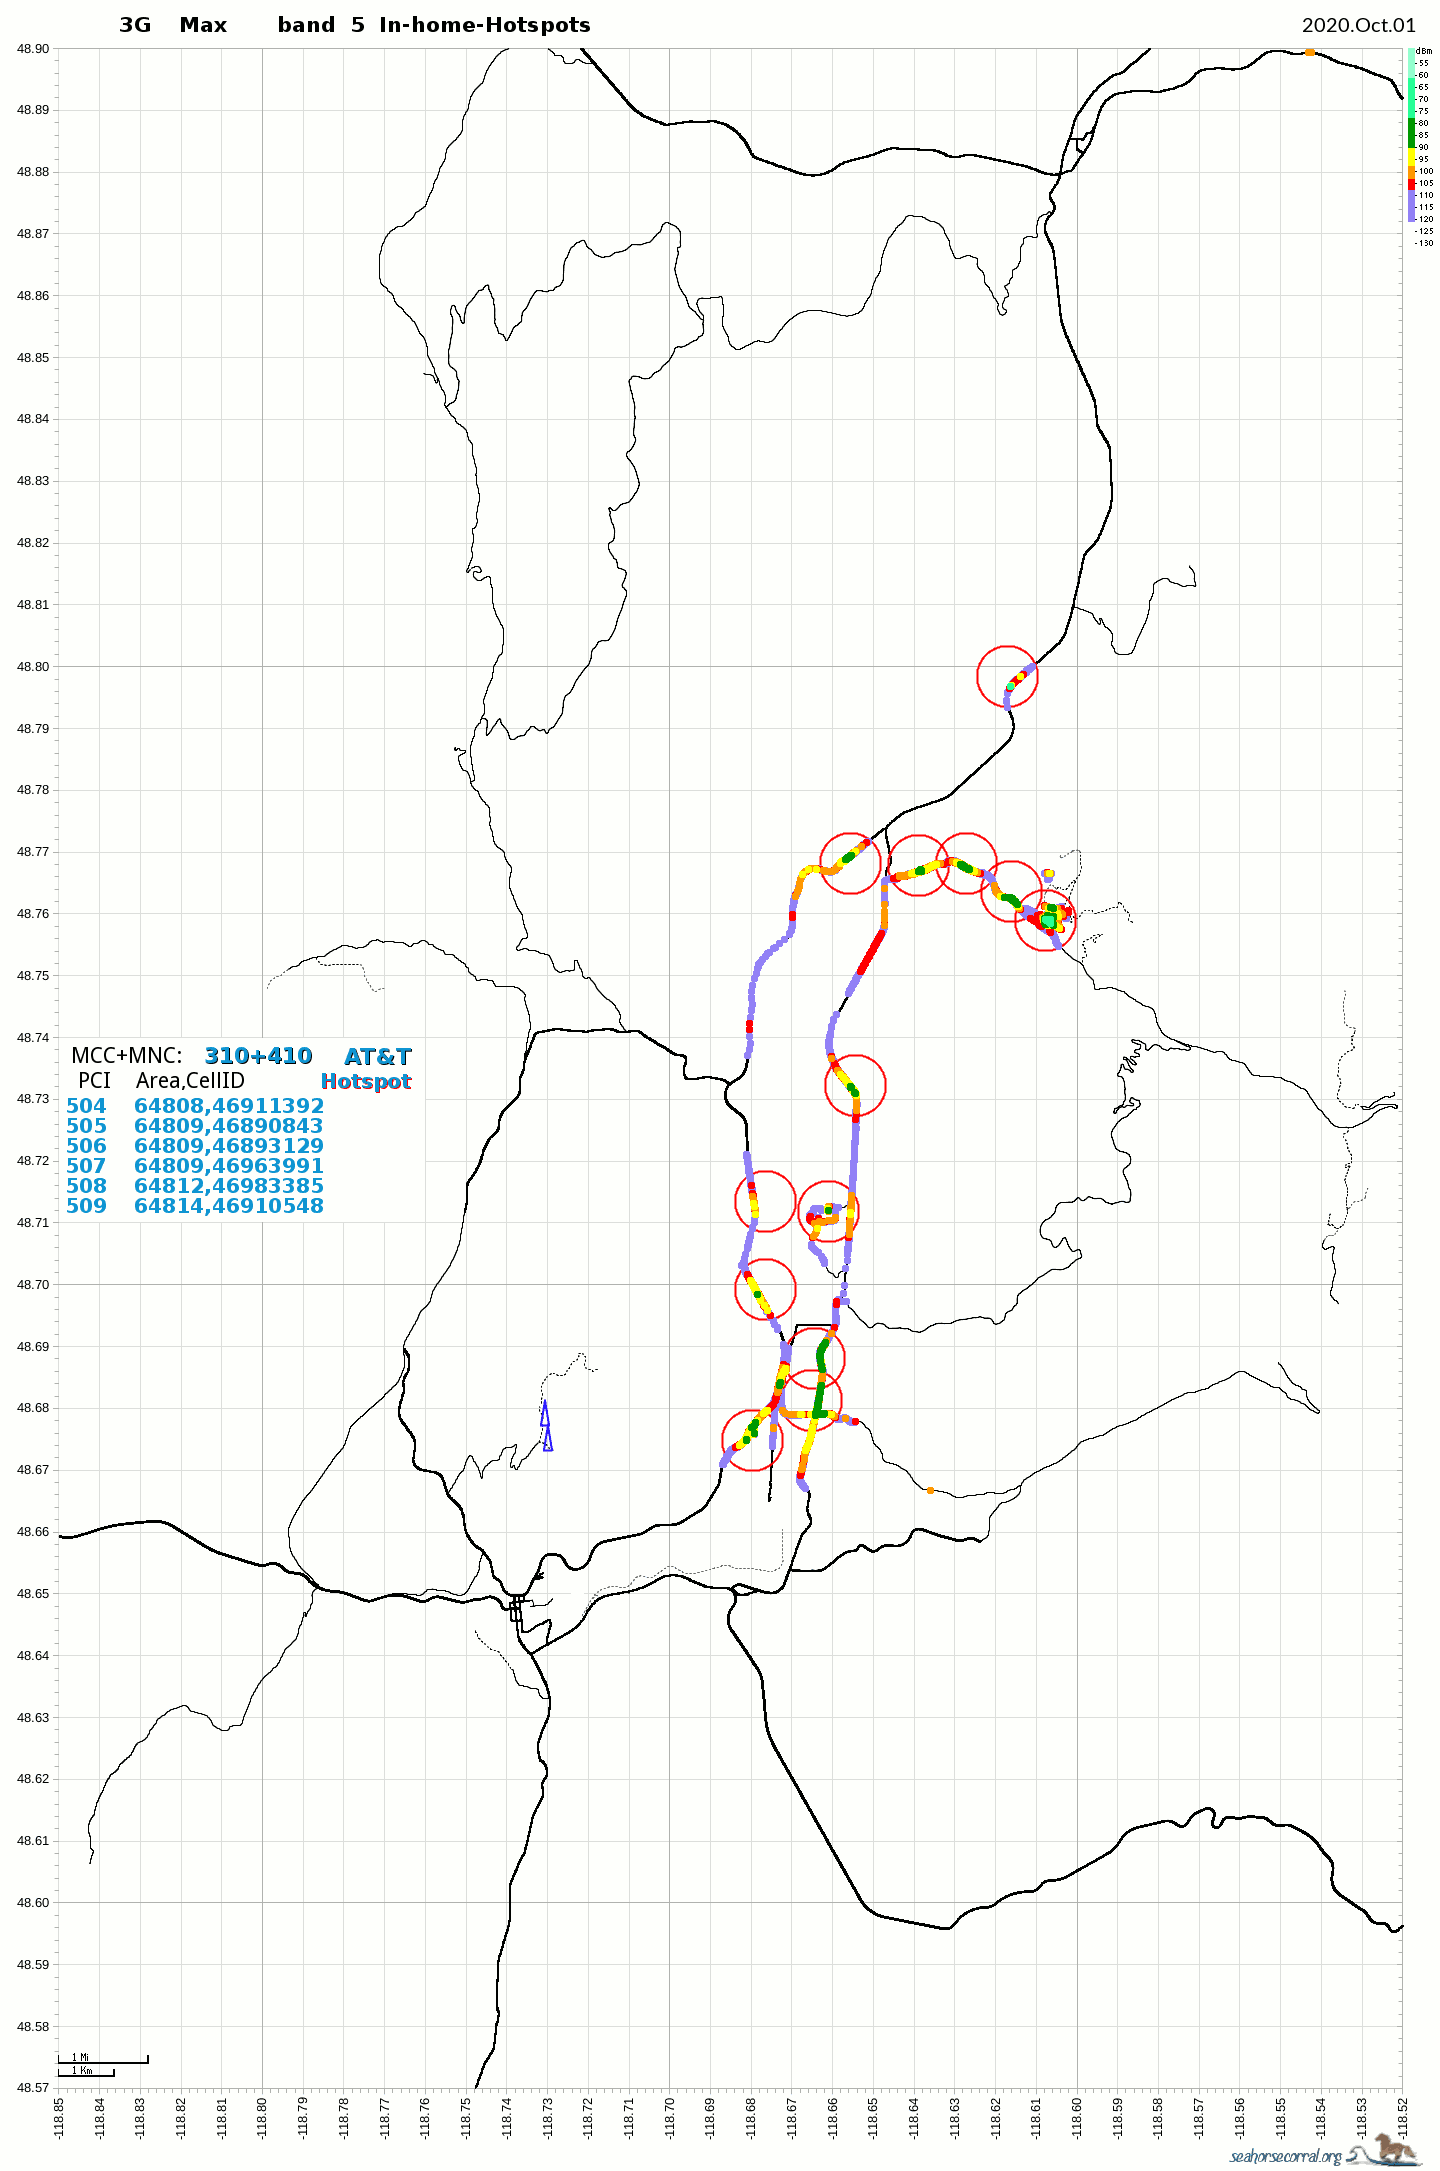 The in-home cellular hot spot has an unusual LAC-CID and seems to take over the Qualcomm firmware, making itself the dominant signal and always making the other signals (from Franson Peak) disappear. The PSC also changes daily, but stays within a range from 504 to 509.


![[Home]](images/home.gif)
![[Next]](images/next.gif)
![[Willapa Valley photos]](images/ebook-19990309-10.06-t60.jpg)
![[Republic photos]](images/20110501_S35SW_LambertMtn-CopperButte_SE_7215-t60.jpg)
![[e-Mail me]](images/mbicon.gif)
![[JPG] Here's an alternative without the aster layer.](images/emf/cellular-map1-aerial.jpg)