Note: The waterfall graphs below cover a frequency range from 0 to 6500Mhz, but the antenna used is only for 700 to 6000Mhz
Therefore discount the signal strength below 700Mhz with regards to accuracy, but it is still useful and interesting to see the relative changes for location and nearby equipment.
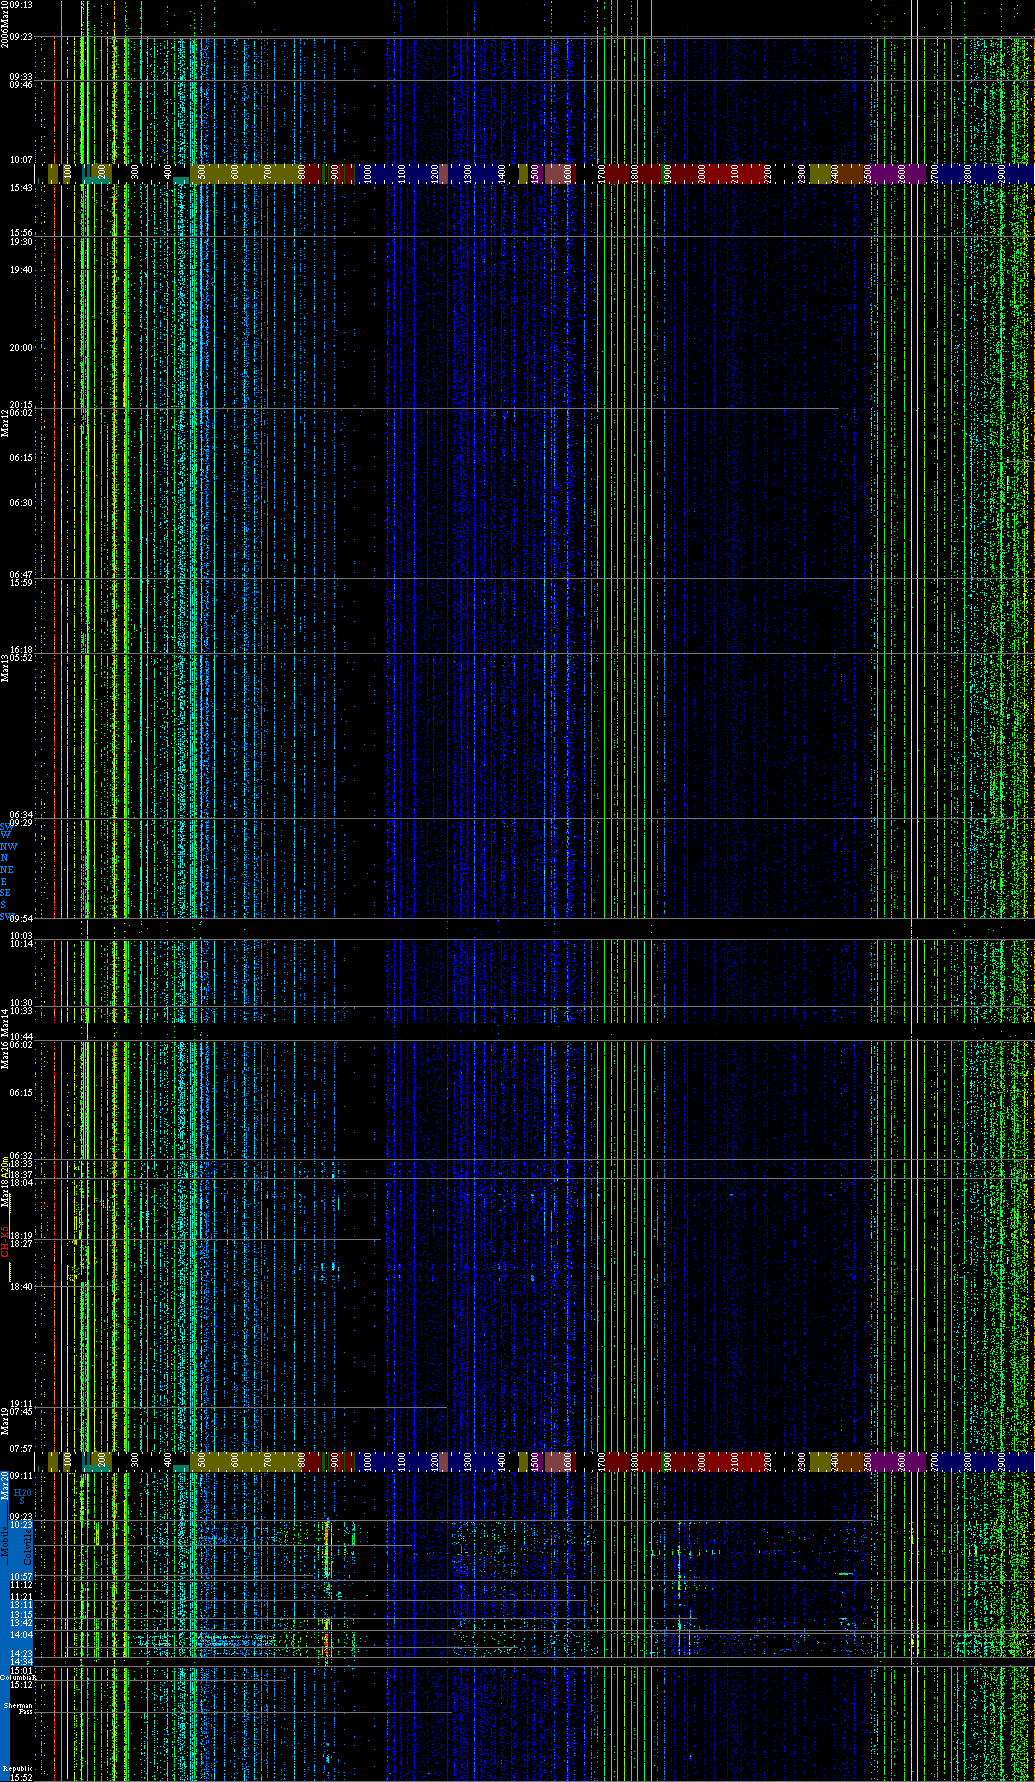
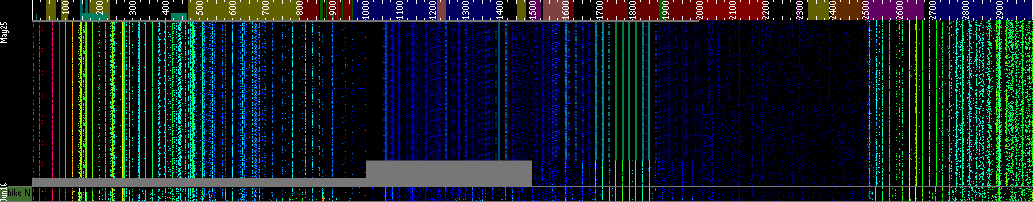
For the graphs below:
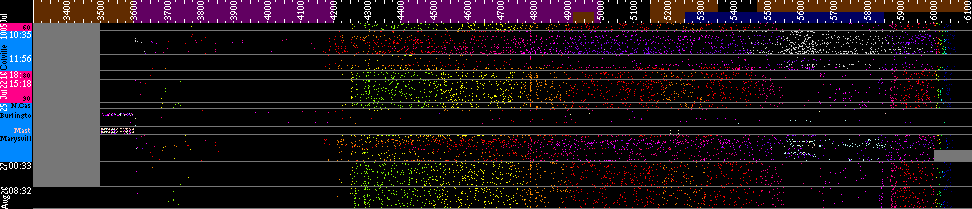
The far left column shows time index, location, and what known EMF sources were nearby, or when the Spectran antenna was itself shielded, (orange on grey).
The first row has pulse mode off. Notice the blacker field, or less signals detected. The results shown in this configuration (or mode) are the most accurate for measuring actual power density and detected signals.
Blue background
denotes away from home. Going thru town or past towers.
Pink background is from when I was getting elevated readings on my Zap Checker, but could not find the corresponding signal on the Spectran.
2006.March
From 0 Mhz to 3000 Mhz, 3Mhz bandwidth, PulseMode on for 29 of 33 recordings
Equipment upgrade due to problem with DC power plug. Still Rev.2
You may notice the signal strength below 700MHz is different. Again, it is to be disregarded for comparisons of signal strength accuracy, as above for the same reason, the hyperlog antenna is only calibrated above 700 Mhz. However comparisons within the time frame using the same equipment is the important detail shown here.
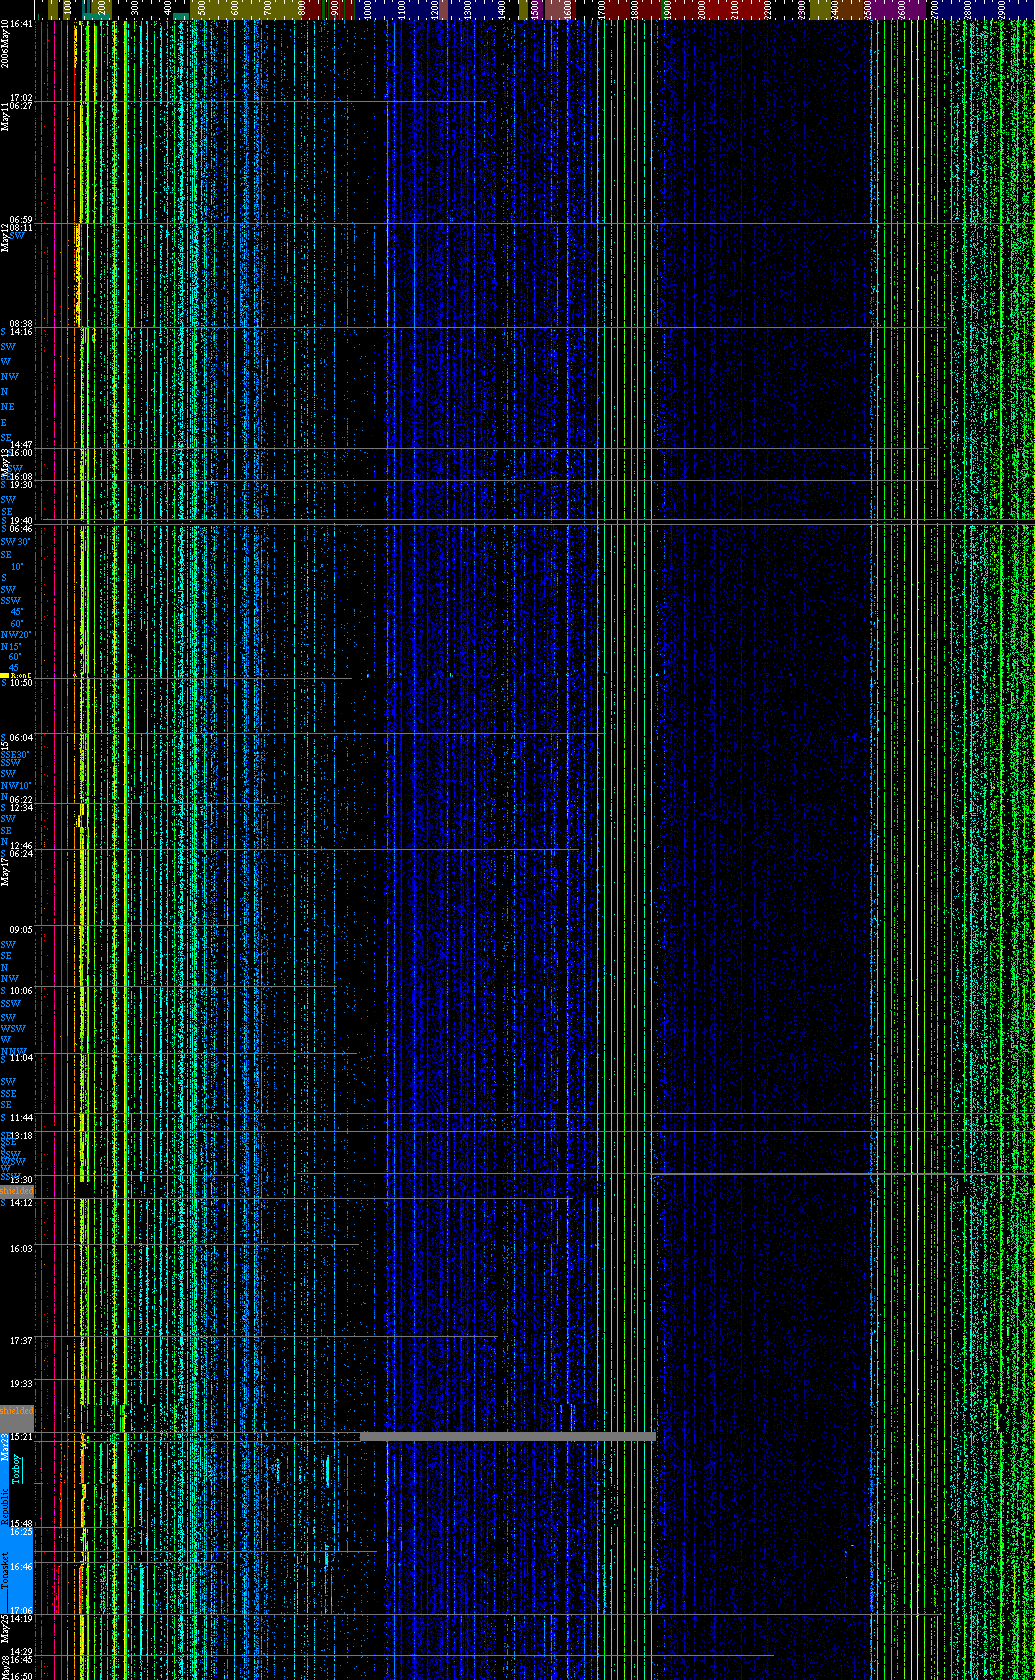
2006.May 2006.July
The spikes when driving by new towers is clearly seen here. With these results I can say "Here are the frequencies being broadcast by these specific towers." 2009.May - Jun 2010.Apr
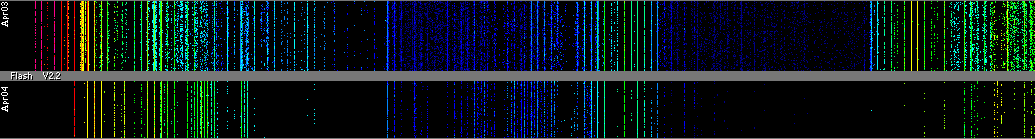
Flashed a new firmware version, and the noise floor changed, or more.
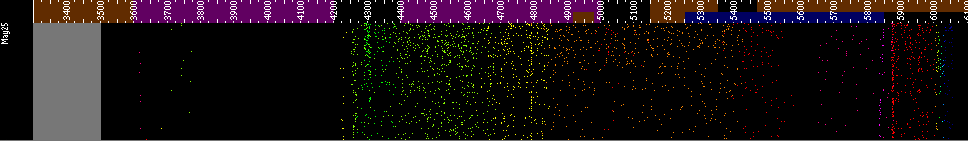
From 3500 Mhz to 6000 Mhz, 3Mhz bandwidth, PulseMode on 2006.March 2006.May 2006.July 2009.May 2010.Apr
(please note, PulseMode turns off Phantom filtering. Thus aliases, or echos at 20Mhz from actual signal may show up.)
However, due to the nature of pulsed digital signals, PulseMode is required to see them.
Preliminary conclusions:
The background radiation is growing/increasing year by year. We can feel it, even here. Here are attempts to graph and document the current situation, with numbers.
TV stations are 90 miles away. Calibration of meter below 700Mhz is not guaranteed. Therefore strength of low frequency signals is not certain with this equipment.
Medium signals from within 9 miles:
1700-1850Mhz PCS and GSM celphones
5800-5900Mhz Wireless internet or Wlan
Medium signals that blanket entire area from great distances:
various Radar
4300Mhz Aircraft radar altimeter
Colville
Very noisy and painful to be around now.
Various wireless phones, wlan, point 2 point.
traveled to Marysville
870Mhz, 1900Mhz, 2800Mhz, 3600Mhz Towers and masts can be seen, much louder than background.
Since the above was written, I have become aware of unfavorable reports from testing of the Aaronia Spectran. Also after writing to Aaronia myself about trying to decipher the signals detected, I have concluded the above measurements are not accurate enough to rely on, without being an expert myself in using the equipment properly, and they insist I read the manual, as if I have not several times!
However, I do think the above graphs are useful as an indicator of overall noise level in the air, and as a comparison between multiple locations.
Since Aaronia has a 10 year replacement warranty, I hope they release a more accurate version within that time.
I have the Revision 2 model. I am not getting the Revision 3 model, as there are reports that it is not better.
The fact I am getting the same "background" levels across all locations, including deep in the Cascade mountain range far from known towers, leads me to disregard the consistant lines as non-existant. Unfortunately, only looking at the changes from place to place, is not a good way to determine actual power density levels.
This is as would be expected, for a spectrum analyzer is meant to be used for drilling down into frequencies, not for measuring the general power density as a broadband meter does.
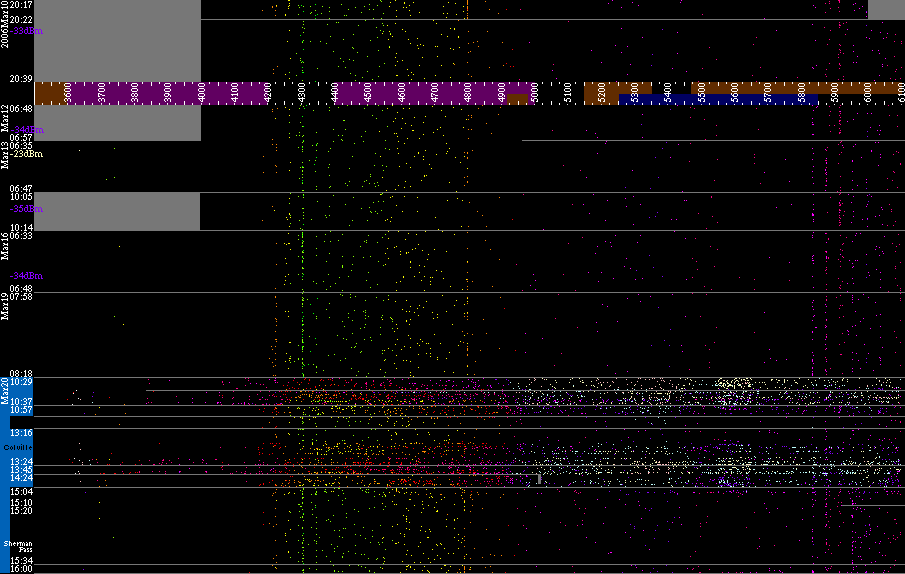
Since the above no longer compares to previous years, (see 2006.July for most relevant comparison) I will change from 3 MHz bandwidth to 1, increasing the resolution, and hopefully increasing the accuracy. One or two anomolies in the above graphs are at 1046 and 1206 MHz, for which I have no good explanation yet. It does look like a "birdie."
From 30 to 3000 MHz or 700 to 3000 MHz, 1Mhz bandwidth
amp OFF NonPeak
Sep.27 Republic
Oct.01 Spokane parking garage
Nov.08 Republic
PEAK on
Tonasket
Nov.08 3 miles Republic
amp ON PEAK on
Oct.01
Airway Heights
R49 to Republic
Oct.07 8 miles: Republic to Flag Rd
Oct.25
NonPeak
Oct.01 Spokane parking garage
It appears that starting the sweep at 700MHz gives different results, up to about 1050 MHz. So much for accuracy.
From 3000 to 6000 MHz, 3Mhz bandwidth
amp OFF NonPeak Republic
PEAK on
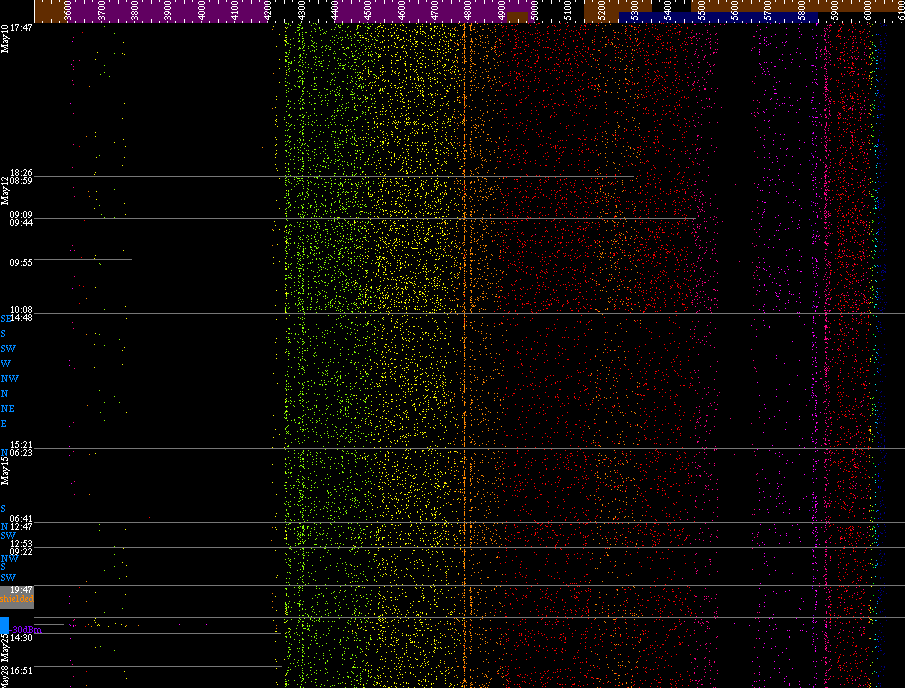
From 3000 MHz to 6000 MHz, 1MHz bandwidth
amp OFF NonPeak
Oct.25 Republic
PEAK on
Tonasket
Nov.08 14 miles Republic to Lambert
amp ON
Peak ON Oct.07 Tonasket
24 miles: Scatter Creek to Republic to Lambert Creek
Oct.25 Republic
Some unanswered questions:
Why are the data points lower in strength with the Amplifier ON?
At least it does increase the contrast, which should make it easier to pick out the real signals nearby.
And why is there so little change when I drive through town or past transmitters that show up on other meters quite clearly?
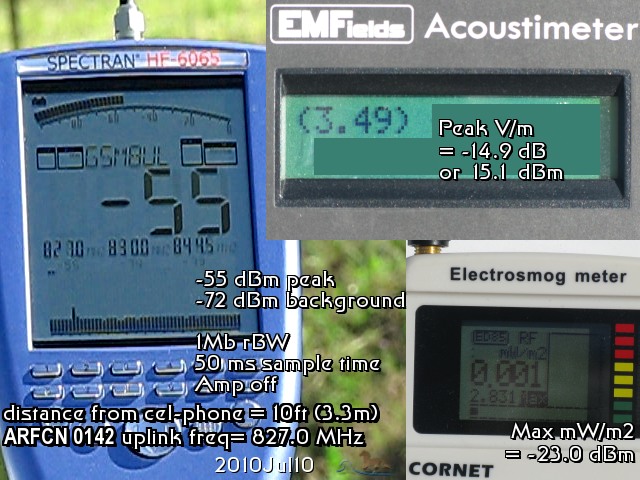
Case in point, aiming at a celphone, at 827Mhz I do see a spike up from -72 dBm to -55 dBm.
Barely perceptable on the Spectran. I would expect to see more than a few blips.
When I changed the bandwidth to 3Mhz, the Spectran was flat at -68 dBm, and showed nothing, while the Acoustimeter loudly announced the phone was transmitting. I am not impressed.
2010.Jun. Aaronia's response, Why do you think its working in the GSM900 range? Propably its using the GSM1800 or UMTS i think thats simply the problem
2011.Dec. Yes it took me over a year to learn the Samsung debug codes, so that now I can prove what frequency the closest cell phone tower here is using. ARFCN 0142 is GSM850 on an uplink frequency of 827.0 Mhz. So my original question IS valid. As the receiving tower is 7 miles away, I have a hard time believing the Spectran's reading is the most accurate in measuring the cell phone transmitting power level.
The upper frequencies (1800-1900) are not used in rural places, only in cities and towns! Where direct line of sight and short ranges are the rule.
It is very non-helpful to keep telling me to read the manual, and for some bandwidth settings, So NEVER use the 50MHz RBW if you are no pro user. I think what Aaronia is telling me, is that this product is not for me. Not what I intended to use it for. Really? Huh.
Before I upgraded to version 4, I asked Aaronia specifically, if the upgrade would allow me to see WiFi beacons. They said Yes. I see No. I've tried various bandwidths, even narrow in the WiFi channel range that the Canary Hotspotter says it sees. Spectran can't see it. Now that's not very useful. A $30 hotspotter can see WiFi where the $2000 Spectran (with additional modules) can't. Perhaps Aaronia is right: This is not the tool I wanted. So not only am I "not impressed", but I'm also a very disatisfied customer. And Aaronia does not give refunds, so this device goes in the closet as a failure.
2013.Dec. I now have the RF Explorer, sold by Nuts for Nets. (Yeah I'm nuts all right, but not in the way they intended.)
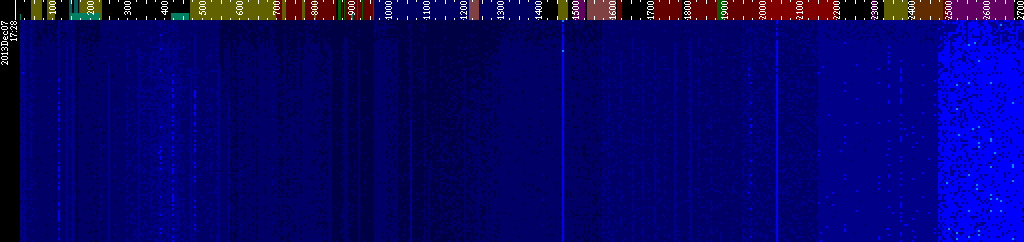
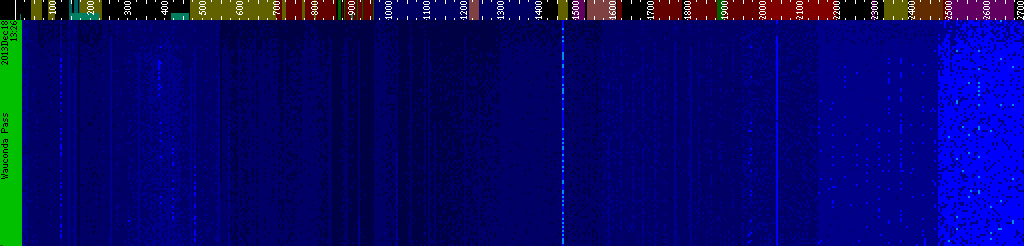
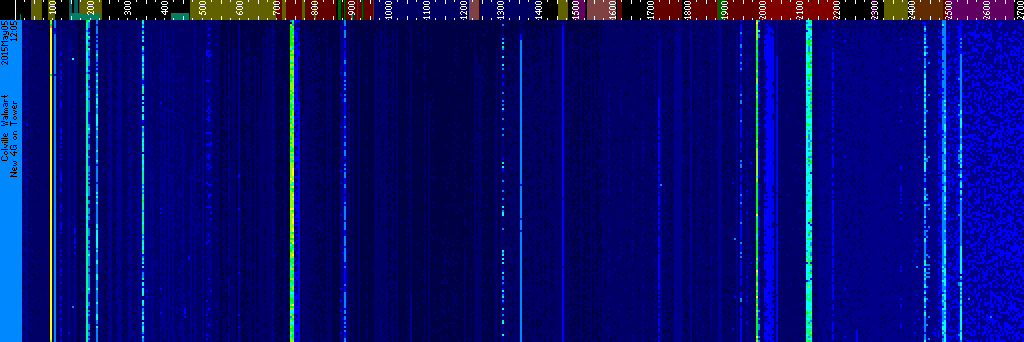
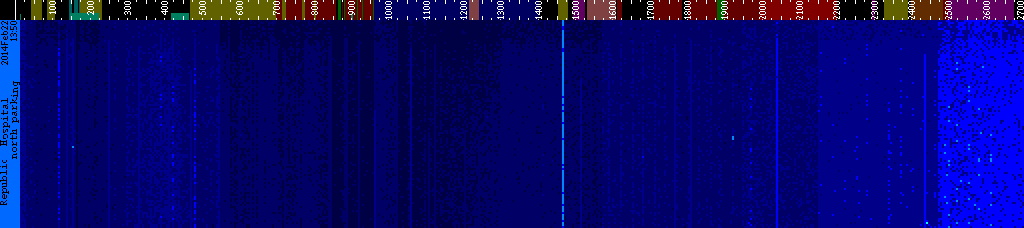
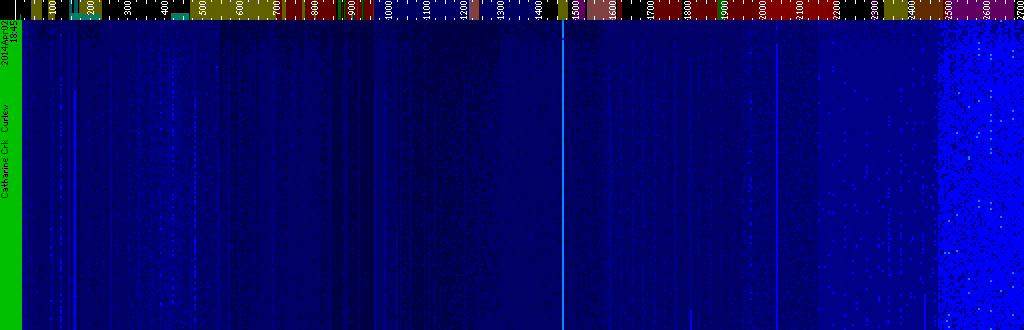
It not only works, but it works very well, and costs much less. Cellular towers stand out at wide bandwidth. When I drill down (narrow the bandwidth) the cellular downlink signals are clear, stand out from the background, and the signal strength is believable. Here are some nice waterfall graphs from various places, to compare with earlier years shown above. Obviously, not as a direct comparison, for the same reasons stated earlier... but the difference in the results is striking.
Now the offending devices really stand out. Now my spectrum analysis can shine again!
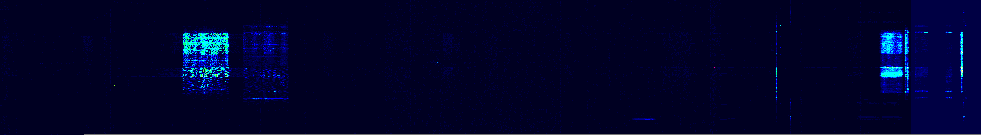
RF-Explorer spectrum graph 2013.Dec.07 17:28 - 17:48 Lambert Crk valley, Republic, WA
RF-Explorer spectrum graph 2013.Dec.18 13:26 - 13:37 Wauconda Pass, WA
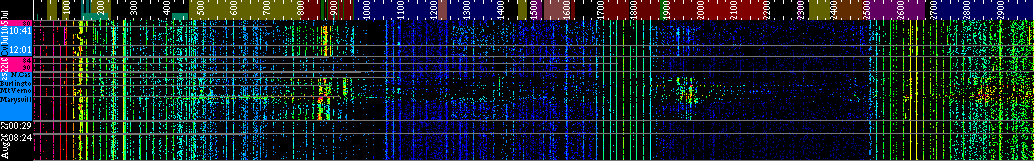
RF-Explorer spectrum graph 2014.Jan.23 11:43 - 12:05 Colville, WA
RF-Explorer spectrum graph 2015.May.05 11:42 - 12:05 Colville, WA
RF-Explorer spectrum graph 2014.Feb.22 13:36 - 13:50 Republic, WA
Wow! I'm glad I don't live in Portland Oregon. What a big pain! These graphs speak loudly all that need be said. Some places are quiet, and some places stand out at vary-ing levels of noise, with the Big-city measurement at the bottom (just above) making a mega-impact.
The cellular frequencies stand out (above) like a sore thumb, or in my case, a sore head. 3G and WCDMA are strongest above 1900MHz, and the new AWS above 2100MHz. Exactly what is expected in the city.
FM radio around 100MHz, older cellular bands from 800-900MHz and newer 4G from 700-800MHz are ones I am familiar with. Various business communications around 450MHz.
The rest of the spectrum seems elevated as well, but not like a blanket. There are bands of activity that are unexpected to me, and unexplained for now. The task of learning is never done.
The proliferation of wireless gear is an assault on all life. No wonder so many people (and birds, bees, etc) are showing the effects in the urban areas especially.
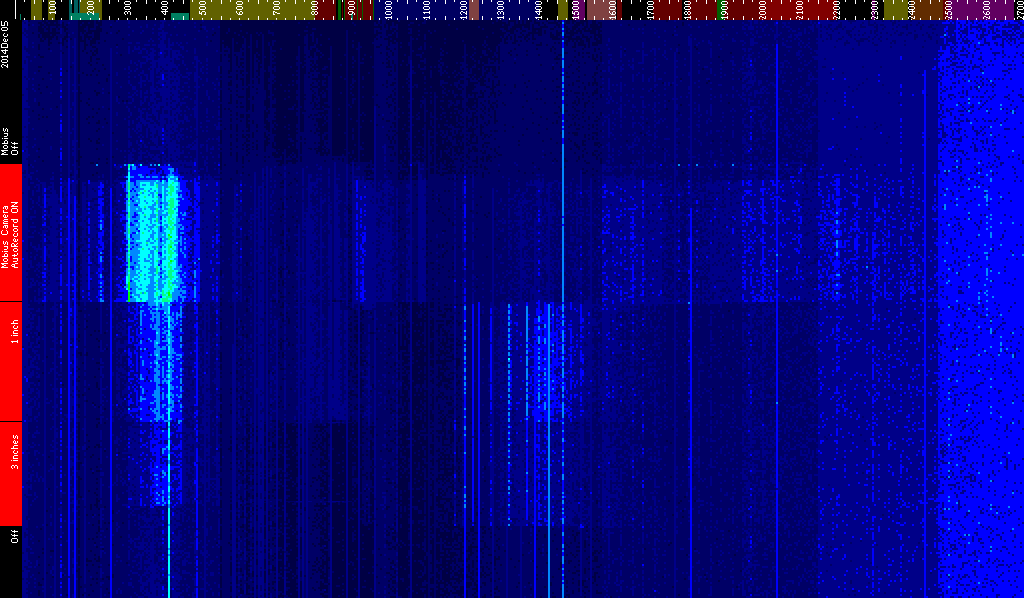
Next is putting the spectrum analyzer to a different use, taking measurements of a few devices, to see how much RFI (radio frequency Interference) they put out.
Here above is a measurement of a HDDVR-Mobius, it is not as quiet as I would prefer, but is "acceptable" at several inches away from me. (Read into that what you will, but "acceptable" is not a happy condition, and only valid as a trade off.) Here the RFI between 350 and 440 MHz stands out strongest, and is the source of many complaints of tiny cameras interferring with other equipment.
First was up close at zero inches, then 1 inch away, then 3 inches away to show how fast the RFI drops off.
The "stuck" line anomolies show up on the left side clearly, continuing down the waterfall even when the noise level that started drawing them is gone.
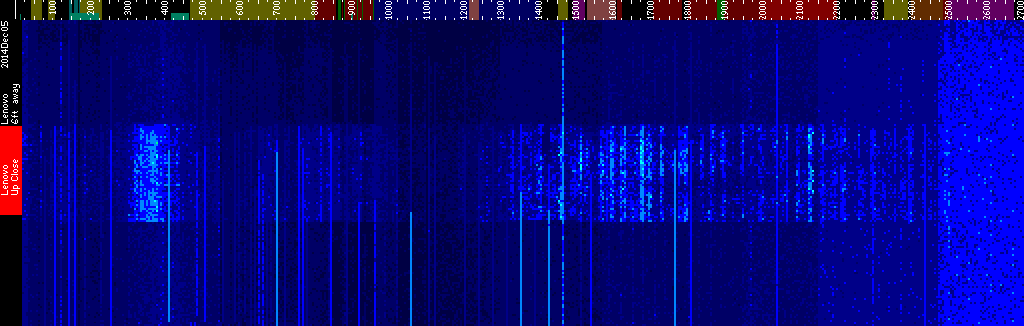
Lenovo Ideapad S10-2. Hottest spot of RFI emissions is between the A and F4 keys.
Again see "stuck" lines continuing down the waterfall that are anomolies. Varying strength levels all across the spectrum. The developer calls these "spurs.", and are known bugs yet to be fixed. When they are fixed, I will have to redo this test to get a cleaner graph.
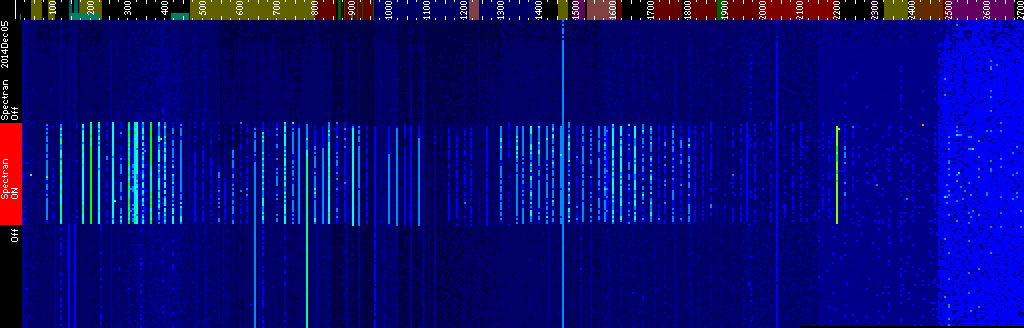
And here is the Spectran HF v4 that I dislike so much. Wow, it really covers the spectrum with RFI! and quite strong too. This is consistent with the other pictures I have taken and posted in Part 2.
2015.Feb
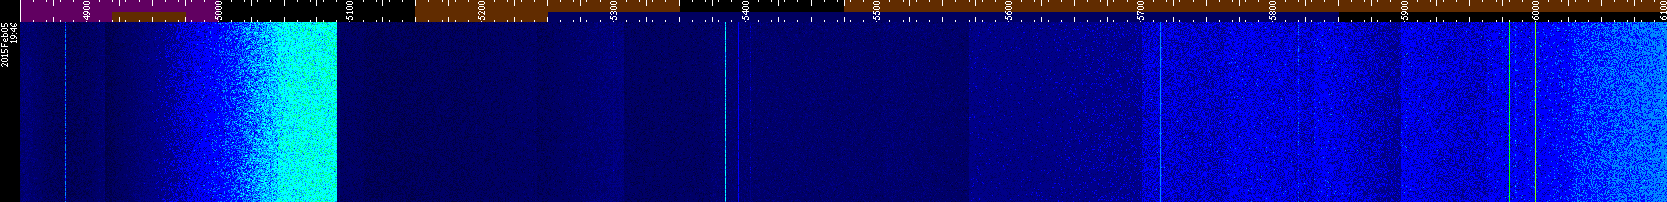
The RF Explorer 6G model is now released. It has a frequency range from 4850 to 6100 MHz. In this upper band are new WiFi channels, aviation radar, and Point to Point microwave towers.
I'll accept this as background levels, except for the ramp up and drop off at 5090 MHz. That doesn't look right. Developer confirms this is from a problem in manufacturing tolerance, so possible solutions are being looked into for future firmware updates.
Focus on GSM or cellular 2G,3G,4G in the lower band:
RF-Explorer spectrum graph 2014.Jan.23 14:25 - 14:29 Colville, WA
Looks like 3G or 4G is in heavy use, and the older 2G band is largely abandoned as newer devices replace older models, and/or not coming from the new tower close by. The high resolution scan is of such high quality that you can almost see individual packets going out to somebodies.
I did this before I figured out what frequencies the new 4G is using. So this only shows 4 bands with gaps between them.
2016.Jan. I've noticed SDR is becoming popular, (Software Defined Radio), and at a price of only $30, much more available to more people. So I wondered how it compares.
RTL SDR spectrum graph 2015.Dec.16 10:33 - 11:54 Republic, WA
On the positive side, I can scan a very wide part of the spectrum, leaving the closed laptop running on automatic, running a script (Linux bash and perl), with no intervention needed on my part. 40 seconds to sweep each line across.
On the negative side, the results change as it heats up, and it has repeating artifacts or harmonics that are both annoying, and with no workaround for. (I have turned the 9 pixels per bin 90° so that the repeating harmonic is horizontal rather than vertical, also makes the overall image narrower so it fits on the screen.) The old saying "You get what you paid for" does apply here. Also getting the software compiled and running was a major chore.
So what is this going to be good for? Ah, driving around. While the results are Raw, and very uncalibrated, once it is warmed up so I can get some results that can be compared with other measurements within the hour, then I can definitely see Where the signals are stronger. And since what I really want to know is what signals each tower is emitting, this gives me the answer, so I can later focus on those bands.
A wide variety of signals across the spectrum can be seen above, in different spots of town. The strongest line(s) were in the downtown business core where the downtown cellular tower above the library is strongest. But the main thing that stands out as I drive away from town (second or bottom image) on the highway, is the cellular towers fade out, then a different one comes into range, then that one too fades.
Click to enlarge to 4560x506. Another positive with the RTL-SDR is that I can have it record very wide ranges with narrow bandwidth. Thus, Lots of resolution. Enough to pick out individual cel-phones transmitting (that's in the bands color coded orange on the ruler. Blue shades are downlink bands.) This span takes 11 seconds to sweep across each line. 2016.Feb, now try that same span 0698-0894 with the RF-Explorer. This will be the first "In motion" recording I've ever done with the RF-Explorer:
That bright green line in the middle (at 780-781 MHz) started when a car phone pulled up along side me, then it (the software bug) got stuck, hiding all actual activity afterward for the next 5 minutes. The sparkles to the left and right side of that line for about 1 minute was while he was using that cel phone, and then minutes later another person. Looks like a spread-spectrum effect, not staying on a single channel. Looks like 3G or 4G. (Good news in April, the software bug has a fix.)
This is looking very interesting, except for the persistant lines, and the admittedly low resolution, only 112 pixels wide, but 2 lines per second. Clicking on the above image will load it without enlargement. Still it is very useful, once the time stamps are coorelated with location or geo-data.
2016.Mar
Next project is to write some software myself to make custom sweeps from Linux, using the example python API. I have already made available a version-1.0 tarball, and the results are thus:
Click to enlarge to 3920 pixels wide. Nice clean graph. 43 seconds per line, or one line every 43 seconds. No sticky lines, as the RFE is reset every two seconds to adjust the range across. On the downside, the whole graph is darker, indicating lower power levels measured. Not seeing the high readings in locations that are known to be hot. Same equipment, same graphing parameters, single pass instead of 150 sweeps. Lower readings. It seems to get the higher readings, the device needs to "gradually increase detection of the noise floor," to be calibrated accurately. (At least that was the explanation 2 years ago I was given for the gradual increase at the beginning of a sweep session.) So this approach may not work... so back to waiting for a better firmware version.
I had big plans for version 2, but got burned out too quickly. The weak results above, removes the zeal to continue down this path. I would still like to get the python version to mimic the windows version, so it's still a good idea, eventually ... 2016.Apr.18
New Windows software 1604_3 [here] along with new firmware Beta 31 now has the option to Disable Remote Max Hold, and this fixes the annoying sticky bug. I've added a new sweep halfway up the page just above the Portland sweep to show one location without bugs.
This page has gotten large enough. Ten years of the early results and learning curve. Now that the benefit of roaming sweeps becomes both clear, and technically possible, exploring further sweeps will be on a new page for the RF Explorer, and a new front page for the RTL SDR.


![[Home]](images/home.gif)
![[Willapa Valley photos]](images/19990309-10.06-t60.jpg)
![[Republic photos]](images/20021128-23.23-t60.jpg)
![[e-Mail me]](images/mbicon.gif)